GEMS 2.0 is a follow-up of the GEMS – Graph Exploration and Manipulation on interactive Surfaces project, which was carried out from November 2012 until February 2016. Similar to its predecessor, GEMS 2.0 is a cooperation between the Interactive Media Lab Dresden at the Technische Universität Dresden and the Chair of Computer Graphics (VC²G) at the University of Rostock. A more extensive overview is also provided on the GEMS 2.0 project website.
Graphs are universally relevant in many application domains, such as communication, transportation, biology, and climatology. In these domains, there is an increasing demand for methods and tools that do not only support working with a graph’s structure, that is, its nodes and edges, but also with numerous data attributes that may be associated with the graph. Understanding such multivariate graphs comprehensively is a significant challenge for the people working with them.
Working with data usually means analyzing them. Interactive visual analysis has proved to be an effective mean to gain insight into data. Yet, there is more to working with graphs than understanding basic information of their structure and attributes. In this proposal, we plan to study how classic exploratory graph analysis can be advanced to include comparative analysis of multiple graphs and the possibility to directly edit a graph’s nodes and edges as well as its associated attributes when necessary.
Associated Publications
Currently, the following publications from the Interactive Media Lab Dresden are associated with the GEMS 2.0 project:
@inbook{horak2021,
author = {Tom Horak and Wolfgang Aigner and Matthew Brehmer and Alark Joshi and Christian Tominski},
editor = {Bongshin Lee and Raimund Dachselt and Petra Isenberg and Eun Kyoung Choe},
title = {Responsive Visualization Design for Mobile Devices},
booktitle = {Mobile Data Visualization},
year = {2021},
pages = {33--66},
doi = {10.1201/9781003090823-2},
publisher = {Chapman and Hall/CRC}
}List of additional material
@inproceedings{Horak2020MultivariateNetworksMobile,
author = {Tom Horak and Ricardo Langner and Raimund Dachselt},
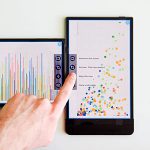
title = {Towards Visualizing and Exploring Multivariate Networks on Mobile Devices},
booktitle = {Companion Proceedings of the 2020 Conference on Interactive Surfaces and Spaces},
series = {ISS '20 Companion},
year = {2020},
month = {11},
location = {Virtual Event, Portugal},
pages = {5--8},
doi = {10.1145/3380867.3426201},
publisher = {ACM},
address = {New York, NY, USA}
}List of additional material
@article{Horak2020ResponsiveMatrixCells,
author = {Tom Horak and Philip Berger and Heidrun Schumann and Raimund Dachselt and Christian Tominski},
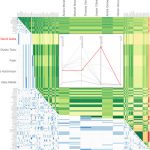
title = {Responsive Matrix Cells: A Focus+Context Approach for Exploring and Editing Multivariate Graphs},
journal = {IEEE Transactions on Visualization and Computer Graphics},
issue = {27},
number = {2},
year = {2021},
month = {2},
location = {Salt Lake City, UT, USA},
pages = {1644--1654},
doi = {10.1109/TVCG.2020.3030371},
publisher = {IEEE}
}List of additional material
, Video, Online Demo
@inproceedings{Klamka2020,
author = {Konstantin Klamka and Tom Horak and Raimund Dachselt},
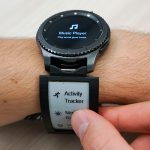
title = {Watch+Strap: Extending Smartwatches with Interactive StrapDisplays},
booktitle = {Proceedings of the CHI Conference on Human Factors in Computing Systems},
year = {2020},
month = {4},
location = {Honolulu, Hawaii, USA},
pages = {72:1--72:15},
doi = {10.1145/3313831.3376199},
publisher = {ACM}
}List of additional material
, Video
@article{Mathisen:2019,
author = {Andreas Mathisen and Tom Horak and Clemens N. Klokmose and Kaj Grønbæk and Niklas Elmqvist},
title = {InsideInsights: Integrating Data-Driven Reporting in Collaborative Visual Analytics},
journal = {Computer Graphics Forum},
volume = {38},
issue = {3},
year = {2019},
month = {6},
location = {Porto, Portugal},
pages = {649--661},
doi = {10.1111/cgf.13717},
publisher = {Wiley Online Library}
}List of additional material
@inproceedings{Horak2019,
author = {Tom Horak and Andreas Mathisen and Clemens N. Klokmose and Raimund Dachselt and Niklas Elmqvist},
title = {Vistribute: Distributing Interactive Visualizations in Dynamic Multi-Device Setups},
booktitle = {Proceedings of the CHI Conference on Human Factors in Computing Systems},
year = {2019},
month = {5},
location = {Glasgow, Scotland, UK},
pages = {616:--616:13},
doi = {10.1145/3290605.3300846},
publisher = {ACM}
}List of additional material
, Video
@inproceedings{fixme,
author = {Tom Horak},
title = {Designing for Visual Data Exploration in Multi-Device Environments},
booktitle = {Extended Abstracts of the CHI Conference on Human Factors in Computing Systems},
year = {2019},
month = {5},
location = {Glasgow, UK, Scotland},
pages = {DC11:1--DC11:6},
doi = {10.1145/3290607.3299086},
publisher = {ACM},
address = {New York, NY, USA}
}List of additional material
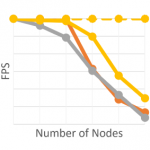
@inproceedings{fixme,
author = {Tom Horak and Ulrike Kister and Raimund Dachselt},
title = {Comparing Rendering Performance of Common Web Technologies for Large Graphs},
booktitle = {Poster Program of the 2018 IEEE VIS Conference},
year = {2018},
month = {10},
location = {Berlin, Germany},
numpages = {2}
}@inproceedings{fixme,
author = {Javid Abbasov and Tom Horak and Raimund Dachselt},
title = {Smartwatch-based Pointing Interaction},
booktitle = {Mensch und Computer 2018 - Tagungsband},
year = {2018},
month = {9},
location = {Dresden, Germany},
pages = {261--265},
doi = {10.18420/muc2018-mci-0373},
publisher = {Gesellschaft f\"{u}r Informatik e.V.}
}List of additional material
@inproceedings{fixme,
author = {Ricardo Langner and Tom Horak and Raimund Dachselt},
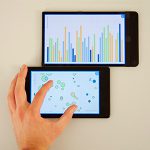
title = {Demonstrating VisTiles: Visual Data Exploration Using Mobile Devices},
booktitle = {Proceedings of the 2018 International Conference on Advanced Visual Interfaces},
series = {AVI '18},
year = {2018},
month = {5},
isbn = {978-1-4503-5616-9},
location = {Castiglione della Pescaia, Grosseto, Italy},
pages = {69:1--69:3},
numpages = {3},
doi = {10.1145/3206505.3206583},
url = {http://doi.org/10.1145/3206505.3206583},
acmid = {3206583},
publisher = {ACM},
address = {New York, NY, USA}
}List of additional material
@inproceedings{Horak2018,
author = {Tom Horak and Sriram Karthik Badam and Niklas Elmqvist and Raimund Dachselt},
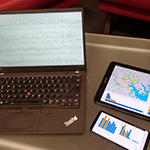
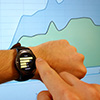
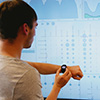
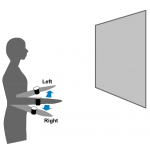
title = {When David Meets Goliath: Combining Smartwatches with a Large Vertical Display for Visual Data Exploration},
booktitle = {Proceedings of the CHI Conference on Human Factors in Computing Systems},
year = {2018},
month = {4},
location = {Montreal, QC, Canada},
pages = {19:1--19:13},
doi = {10.1145/3173574.3173593},
url = {https://doi.org/10.1145/3173574.3173593},
publisher = {ACM}
}List of additional material
, Video
Demonstrating David Meets Goliath: Combining Smartwatches with a Large Vertical Display for Visual Data Exploration
@inproceedings{Horak2018a,
author = {Tom Horak and Sriram Karthik Badam and Niklas Elmqvist and Raimund Dachselt},
title = {Demonstrating David Meets Goliath: Combining Smartwatches with a Large Vertical Display for Visual Data Exploration},
booktitle = {Extended Abstracts of the CHI Conference on Human Factors in Computing Systems},
series = {CHI EA '18},
year = {2018},
month = {4},
location = {Montreal, QC, Canada},
pages = {D414:1--D414:4},
doi = {10.1145/3170427.3186497},
url = {https://doi.org/10.1145/3170427.3186497},
publisher = {ACM}
}List of additional material
, Video
@inproceedings{Horak2018b,
author = {Tom Horak and Raimund Dachselt},
title = {Hierarchical Graphs on Mobile Devices: A Lane-based Approach},
booktitle = {Proceedings of the CHI 2018 Workshop on Data Visualization on Mobile Devices},
series = {MobileVis '18},
year = {2018},
month = {4},
location = {Montreal, QC, Canada},
numpages = {7}
}List of additional material
@article{Langner:2018aa,
author = {Ricardo Langner and Tom Horak and Raimund Dachselt},
title = {VisTiles: Coordinating and Combining Co-located Mobile Devices for Visual Data Exploration},
journal = {IEEE Transactions on Visualization and Computer Graphics},
volume = {24},
issue = {1},
year = {2018},
month = {1},
location = {Phoenix, Arizona USA},
pages = {626--636},
numpages = {11},
doi = {10.1109/TVCG.2017.2744019},
url = {http://dx.doi.org/10.1109/TVCG.2017.2744019},
publisher = {IEEE},
keywords = {collaboration, data visualization, mobile communication, prototypes, smart phones, visualization, mobile devices, coordinated \& multiple views, cross-device interaction, multi-display environment}
}List of additional material
, Video
@inproceedings{fixme,
author = {Tom Horak and Ulrike Kister and Raimund Dachselt},
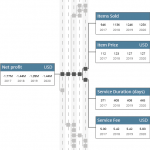
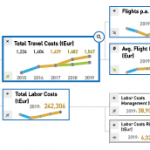
title = {Improving Value Driver Trees to Enhance Business Data Analysis},
booktitle = {Poster Program of the 2017 IEEE VIS Conference},
year = {2017},
month = {10},
location = {Phoenix, Arizona, USA},
numpages = {2}
}
@article{Kister2017_grasp,
author = {Ulrike Kister and Konstantin Klamka and Christian Tominski and Raimund Dachselt},
title = {GraSp: Combining Spatially-aware Mobile Devices and a Display Wall for Graph Visualization and Interaction},
journal = {Computer Graphics Forum},
volume = {36},
number = {3},
year = {2017},
month = {6},
isbn = {1467-8659},
pages = {503--514},
numpages = {9},
doi = {10.1111/cgf.13206},
url = {https://doi.org/10.1111/cgf.13206}
}List of additional material
Associated Student Theses
The following student theses from the Interactive Media Lab Dresden are associated with the GEMS 2.0 project:

Responsive Graphs: Adapting Node-Link Diagrams for Mobile Devices
Tobias Knothe June 19th, 2020 until November 20th, 2020
Supervision: Tom Horak, Eva Goebel, Raimund Dachselt

Strategies for Adapting Visualizations in Dashboards for Usage on Mobile Devices
Lars Arne Beck May 24th, 2019 until December 8th, 2019
Supervision: Tom Horak, Tamara Flemisch, Raimund Dachselt

Visual Data Exploration of Graphs with Cross-Device Workflows between a Large Display and Mobile Devices
Elisabeth Baudisch February 23rd, 2018 until September 22nd, 2018
Supervision: Tom Horak, Ricardo Langner, Raimund Dachselt

Pointing Interaction with Mobile Devices Using Internal Sensors
Javid Abbasov October 2nd, 2017 until March 12th, 2018
Supervision: Tom Horak, Raimund Dachselt

Novel Approaches for Visualizing and Interacting with Data on Smartwatches
Anselm Bunsen June 7th, 2019 until August 23rd, 2019
Supervision: Tom Horak, Konstantin Klamka, Raimund Dachselt

Semi-automatic Editing of Elements and Layout in Multivariate Graph Visualization
Antonio Pietzsch December 15th, 2017 until March 2nd, 2018
Supervision: Tom Horak, Ulrike Kister, Raimund Dachselt

Performance Analysis and Optimization of Web-based Multivariate Graph Visualizations
Robin Thomas November 24th, 2017 until February 9th, 2018
Supervision: Tom Horak, Ulrike Kister, Raimund Dachselt

Embedded Micro Visualizations in Interactive Matrix Visualizations of Multivariate Graphs
Paul Hoffmann May 24th, 2019 until October 11th, 2019
Supervision: Tom Horak, Raimund Dachselt