Investigating the Impact of Real-World Environments on the Perception of 2D Visualizations in Augmented Reality
Abstract
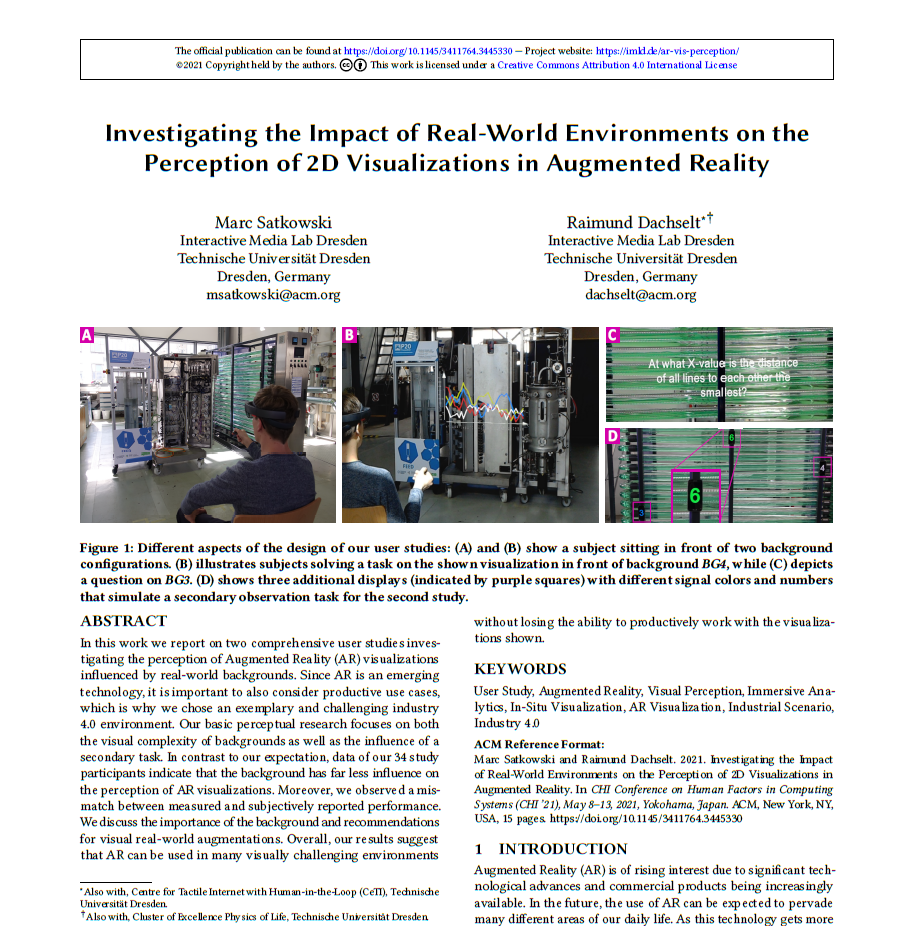
In this work we report on two comprehensive user studies investigating the perception of Augmented Reality (AR) visualizations influenced by real-world backgrounds. Since AR is an emerging technology, it is important to also consider productive use cases, which is why we chose an exemplary and challenging industry 4.0 environment. Our basic perceptual research focuses on both the visual complexity of backgrounds as well as the influence of a secondary task. In contrast to our expectation, data of our 34 study participants indicate that the background has far less influence on the perception of AR visualizations. Moreover, we observed a mismatch between measured and subjectively reported performance. We discuss the importance of the background and recommendations for visual real-world augmentations. Overall, our results suggest that AR can be used in many visually challenging environments without losing the ability to productively work with the visualizations shown.
On this page
Special Thanks
We thank the RTG2323 (https://tu-dresden.de/ing/grk2323) for financing this project as well as helping us with the general use case and scenario. Further, we want to thank the Process-To-Order Lab (see https://tu-dresden.de/ing/forschung/bereichs-labs/P2O-Lab) and its members as well. Without them it wouldn’t have been possible to conduct this study in an real-life experimental production plant.
Media: Videos, Slides, and Supplemental Material
Full Video
Download the pre-print:
Presentation @ ACM CHI ’21
The paper will be published in the Proceedings of the 2021 CHI Conference (Yokohama, Japan). It will be presented online during the conference in May 2021.
30 second Preview
Supplemental Materials
Study Parameters & Tasks
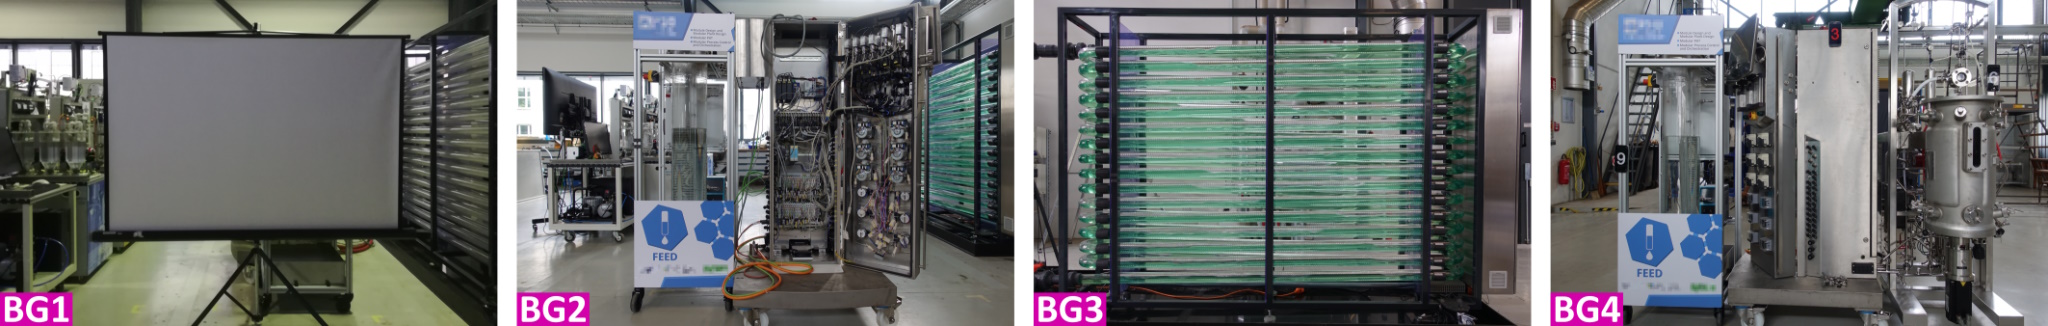
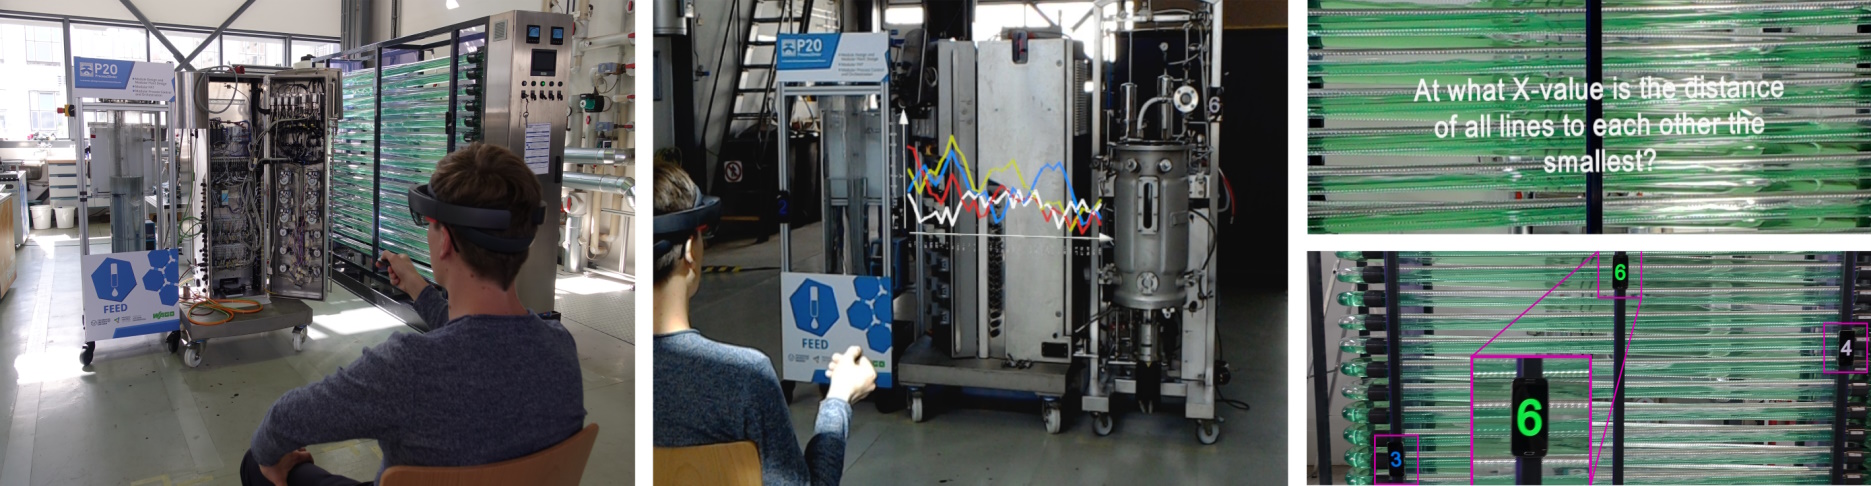
In our two studies, we investigated the influence of 4 different background configurations, which were created in the P2O-Lab. We used BG1, BG2, and BG3 in Study 1, and BG3 and BG4 in Study 2 (see the figure above). In general, participants had to solve different tasks on line charts that were placed in front of the mentioned background configurations (the data for the visualizations can be found in the supplemental material).
In Study 1, we also altered the visualization complexity of the presented line charts. We created 5 different levels of complexity, which were based on the number of data points in the whole visualization. Those are 40, 50, 60, 60, and 70 data points which were altered by the number of lines and data points per line (see the figure to the right).
In Study 2, we fixed the visualization complexity to 140 data points, while introducing another independent variable: a secondary task. This additional condition was either on or off. While this additional task was active, the participants also had to focus on the background as they had to react as soon as a green colored number appeared on one of the three additional placed displays.
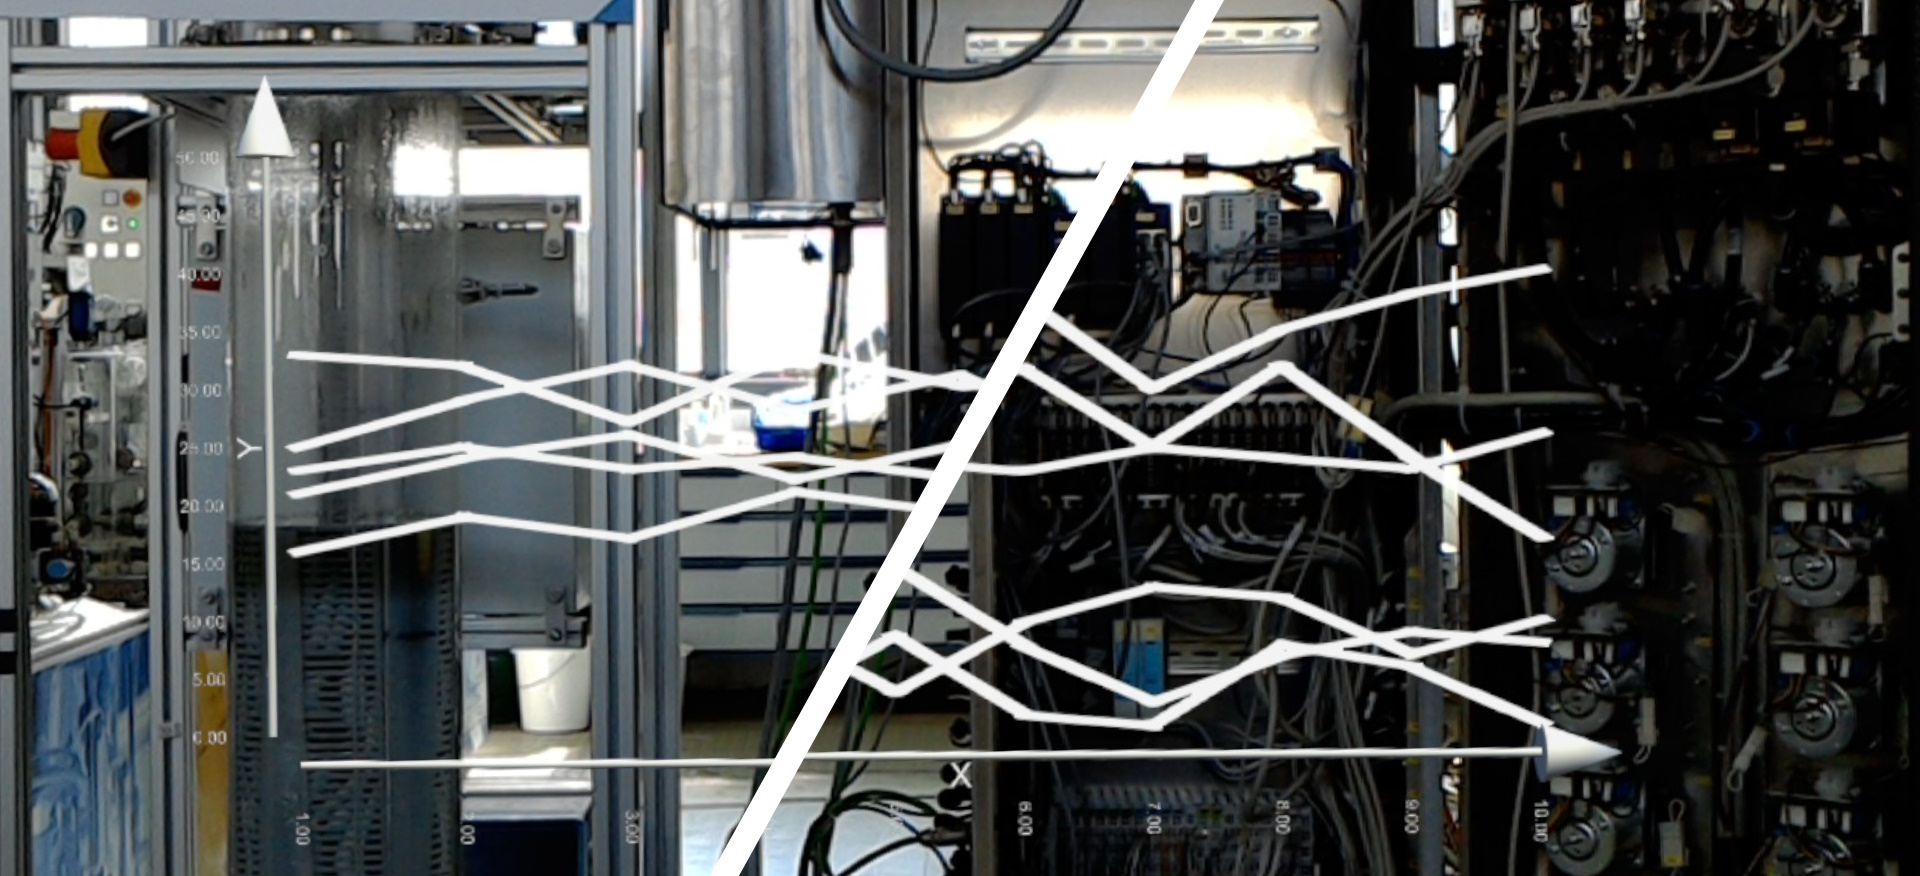
Visualizations of Study 1. (Left) shows a data complexity of 50 (5 lines and 10 data points). (Right) shows a data complexity of 60 (6 lines and 10 data points)
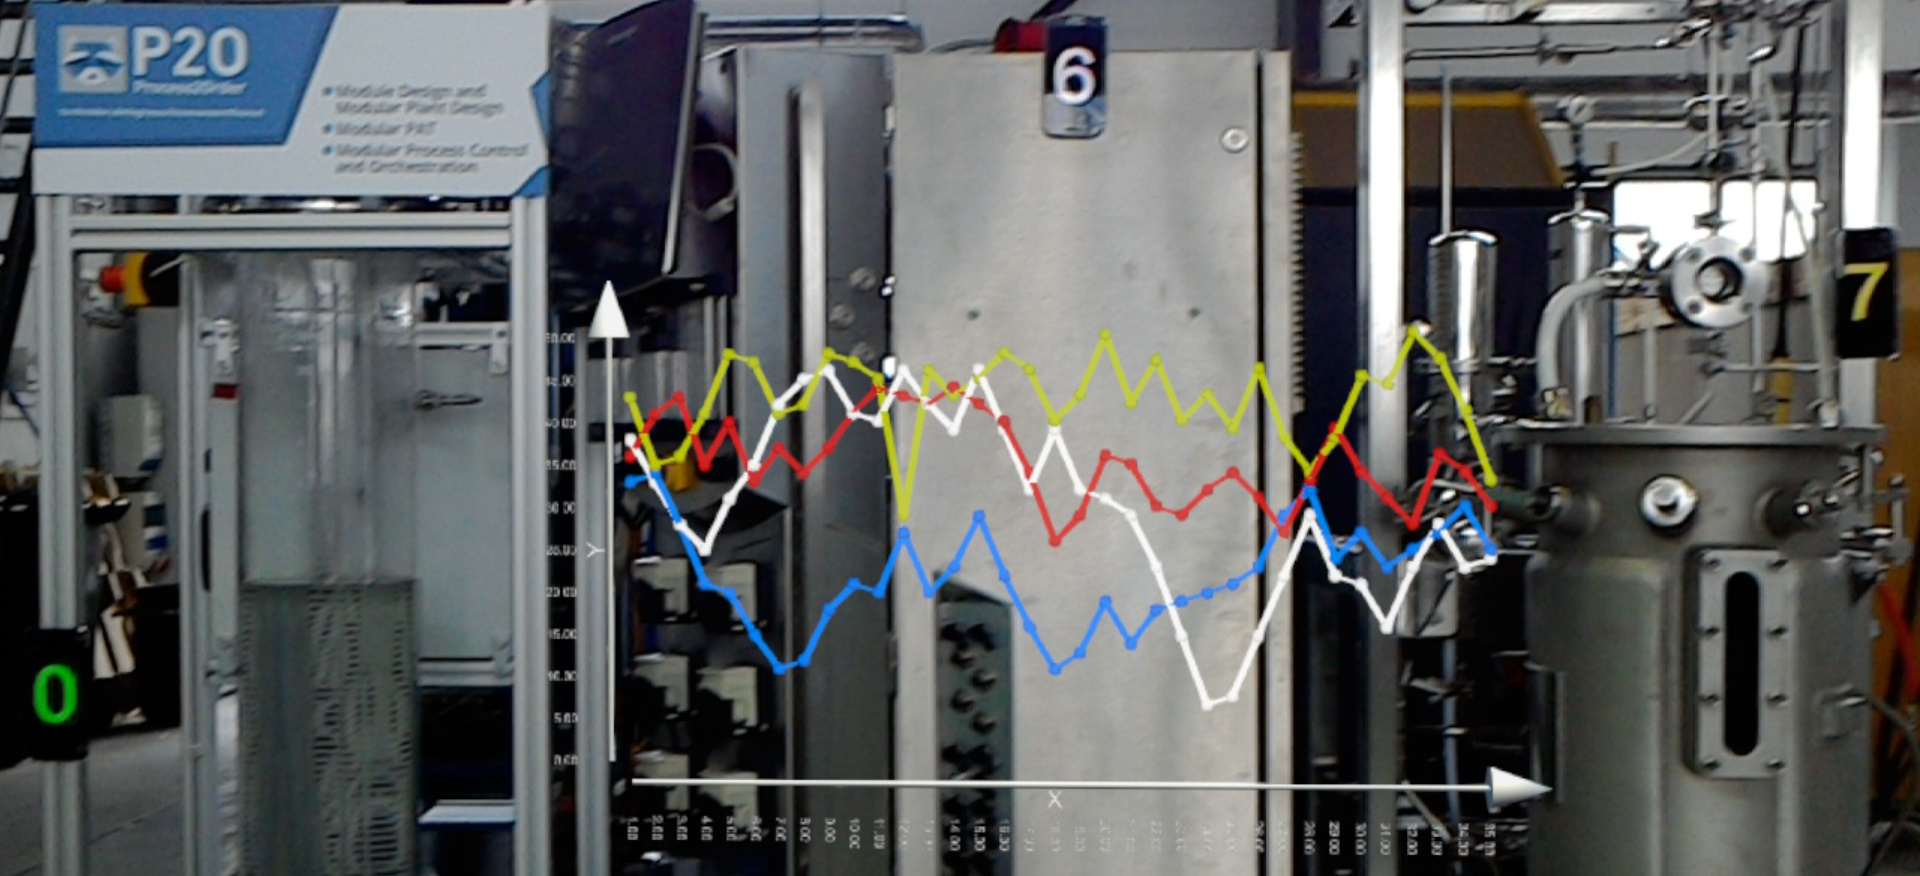
Visualization of Study 2. Placed on the background are 3 additional displays. The left display shows the green signal color which was important for the secondary observation task.
Related Publication
@article{satkowski2021investigating,
author = {Marc Satkowski and Raimund Dachselt},
title = {Investigating the Impact of Real-World Environments on the Perception of 2D Visualizations in Augmented Reality},
booktitle = {Proceedings of the 2021 ACM Conference on Human Factors in Computing Systems},
year = {2021},
month = {05},
isbn = {978-1-4503-8096-6/21/05},
location = {Yokohama, Japan},
numpages = {14},
doi = {10.1145/3411764.3445330},
url = {https://doi.org/10.1145/3411764.3445330},
publisher = {ACM},
keywords = {User Study, Augmented Reality, Visual Perception, Immersive Analytics, In-Situ Visualization, AR Visualization, Industrial Scenario, Industry 4.0}
}List of additional material
Pre-Recorded Talk, Video, Teaser, Study Material, Study Data, Statistical Analysis,