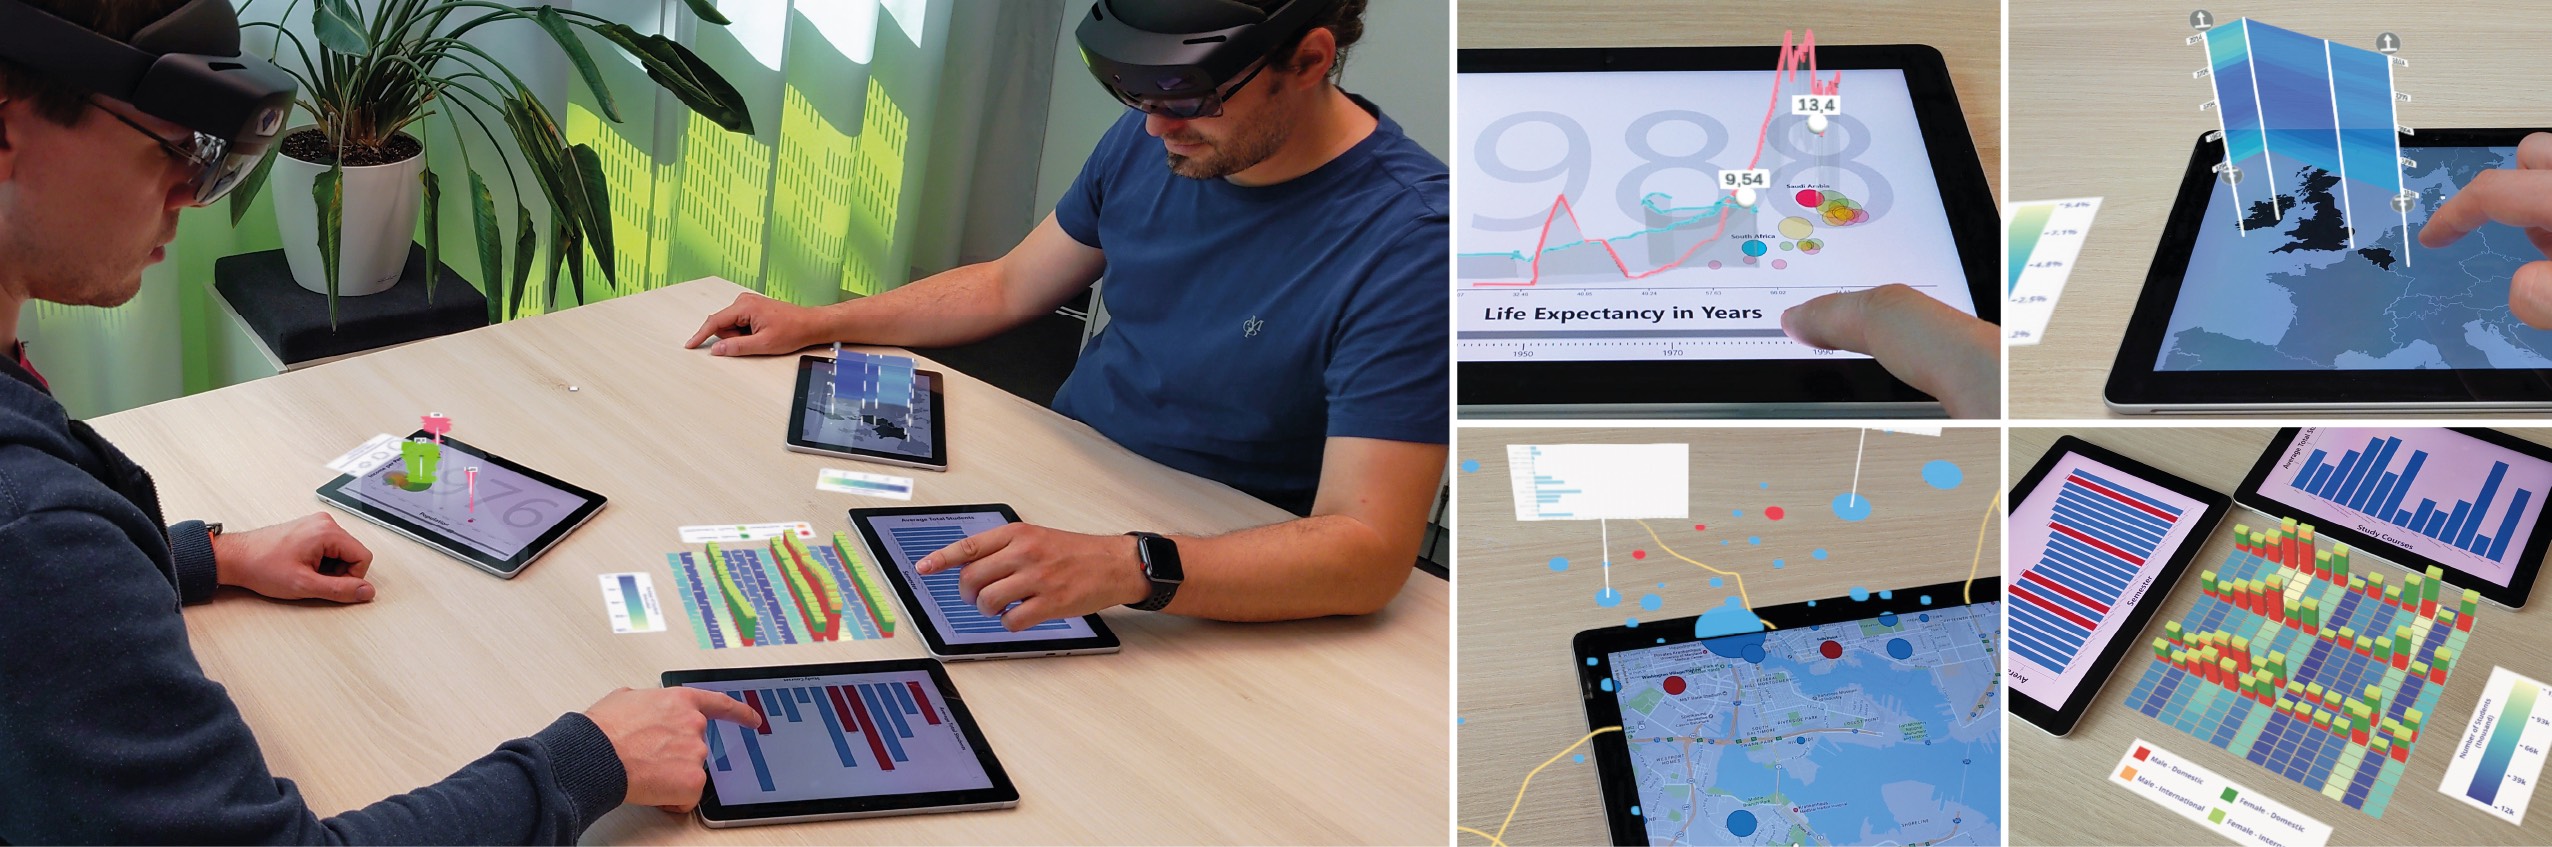
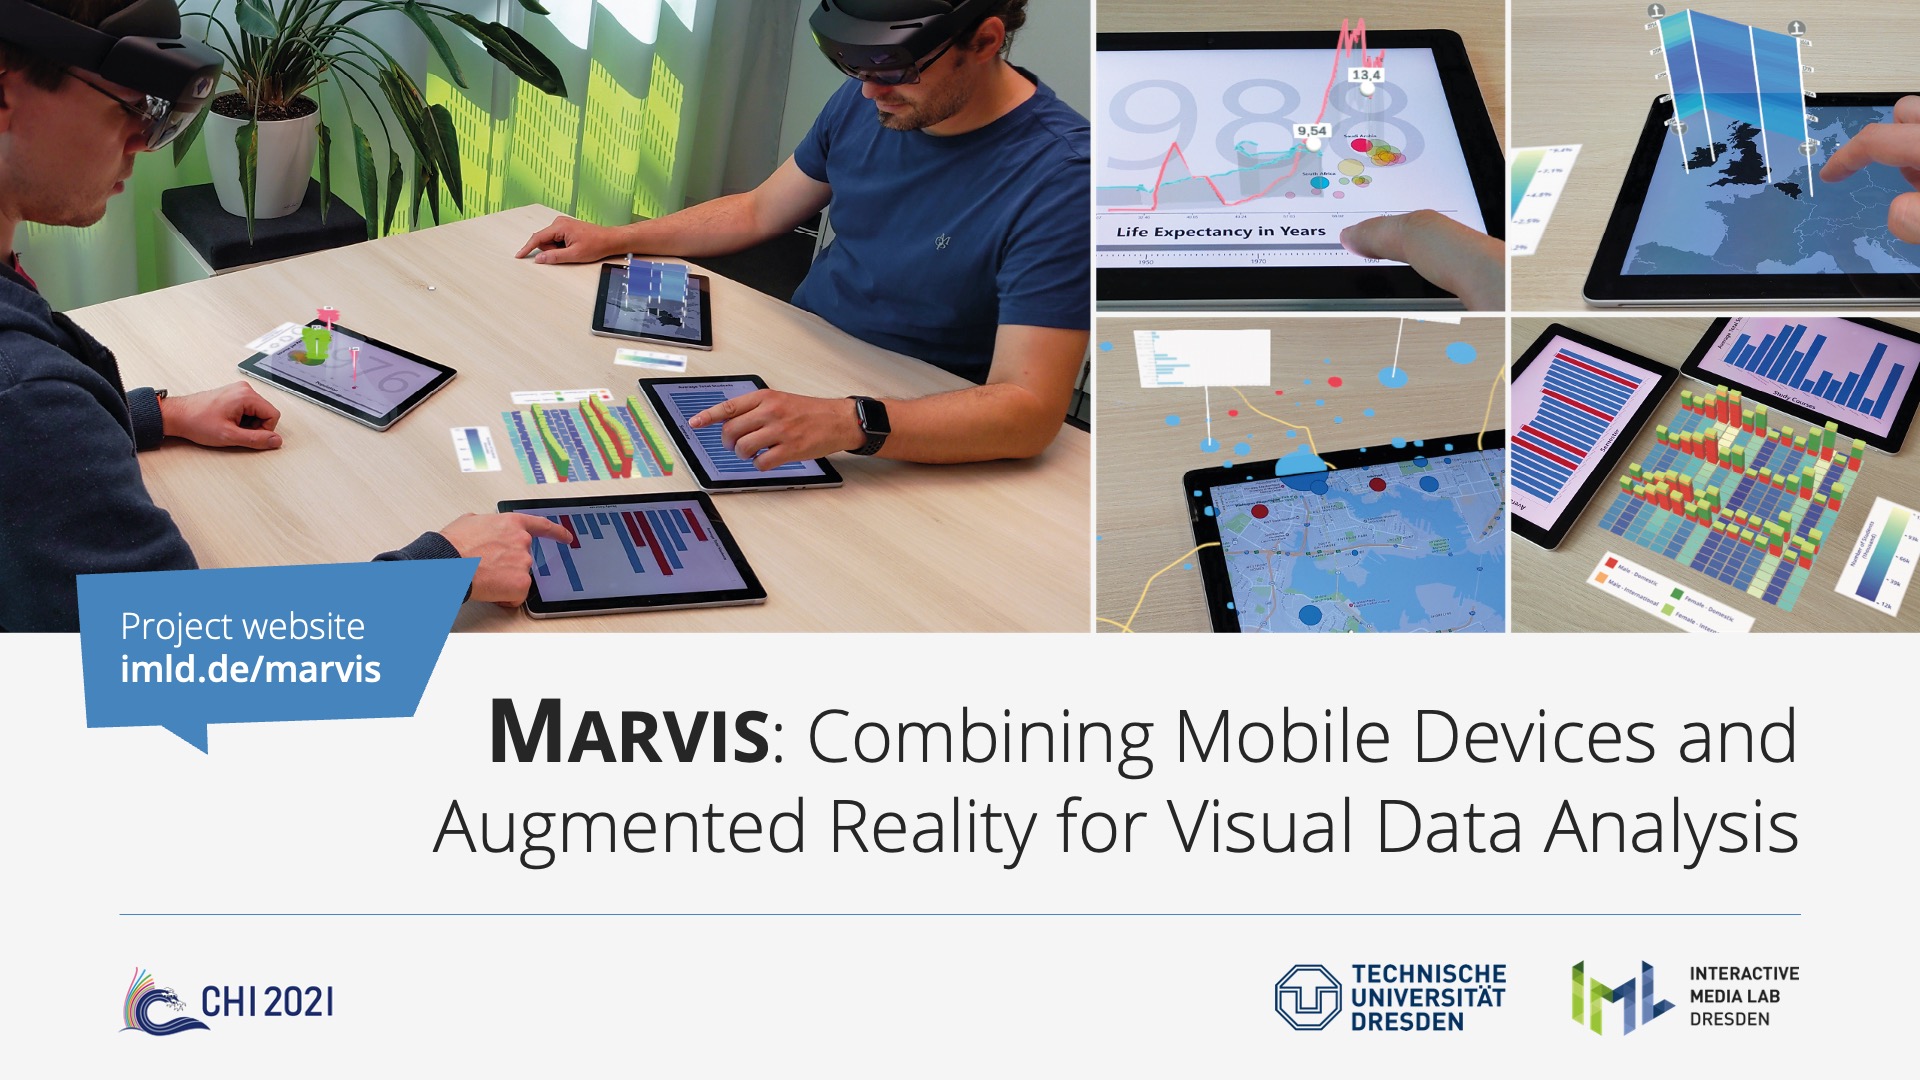
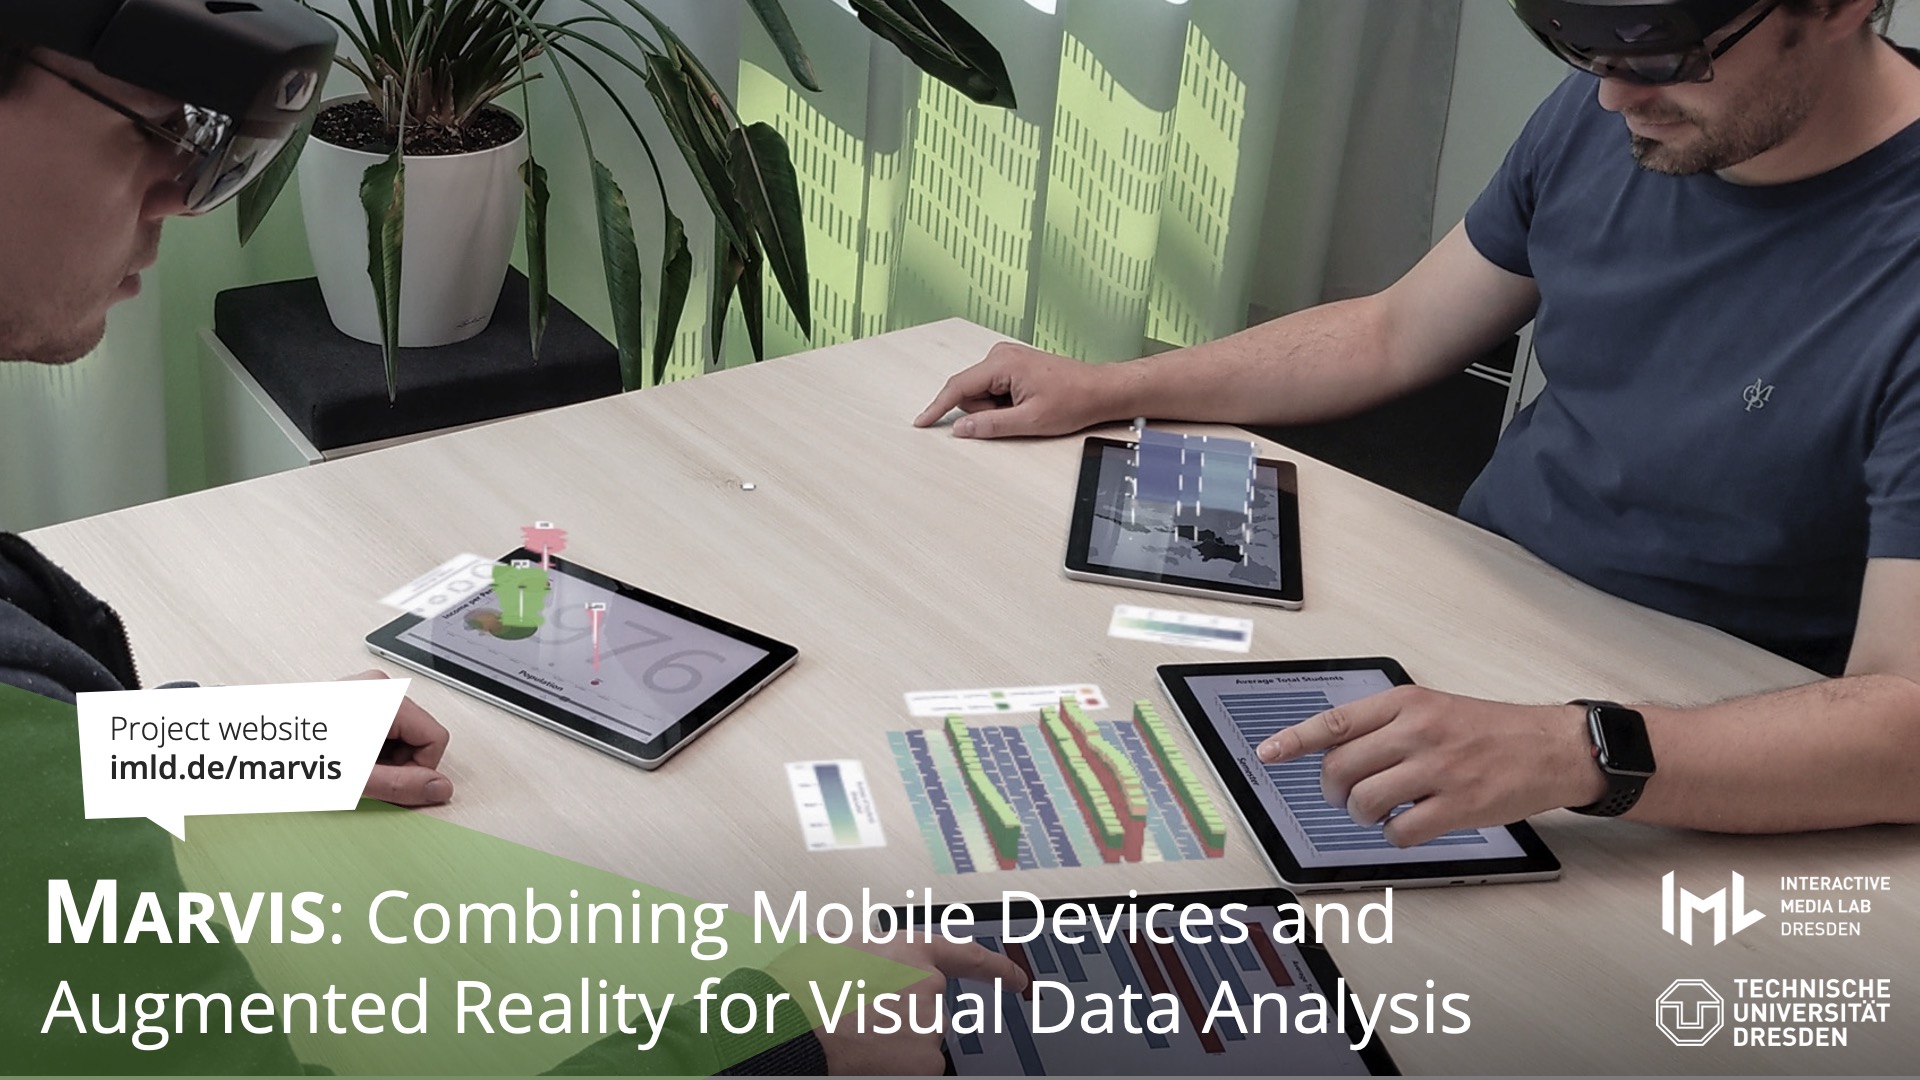
With MARVIS (Mobile Devices and Augmented Reality for Data Visualization), we explore concepts for combining one or multiple mobile displays with 2D and 3D augmentations around, above, and even between them.
Abstract
We present MARVIS, a conceptual framework that combines mobile devices and head-mounted Augmented Reality (AR) for visual data analysis. We propose novel concepts and techniques addressing visualization-specific challenges. By showing additional 2D and 3D information around and above displays, we extend their limited screen space. AR views between displays as well as linking and brushing are also supported, making relationships between separated visualizations plausible. We introduce the design process and rationale for our techniques. To validate MARVIS‘ concepts and show their versatility and widespread applicability, we describe six implemented example use cases. Finally, we discuss insights from expert hands-on reviews. As a result, we contribute to a better understanding of how the combination of one or more mobile devices with AR can benefit visual data analysis. By exploring this new type of visualization environment, we hope to provide a foundation and inspiration for future mobile data visualizations.
Media: Videos and Slides
MARVIS Full Video
Watch the video on YouTube. This video shows basic concepts and the implemented prototype of MARVIS.
Visualization and Interaction Concepts
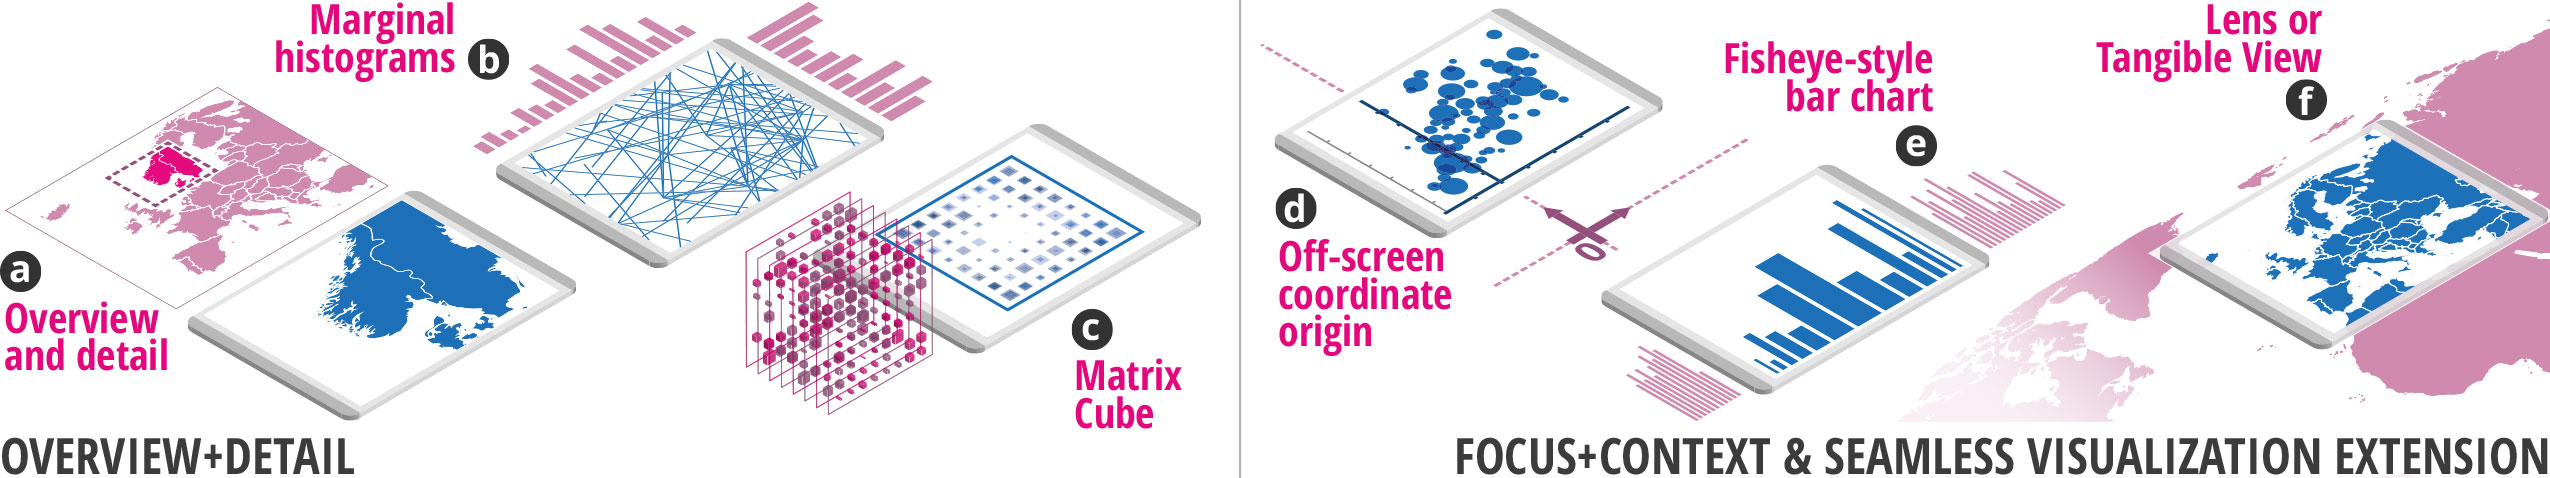
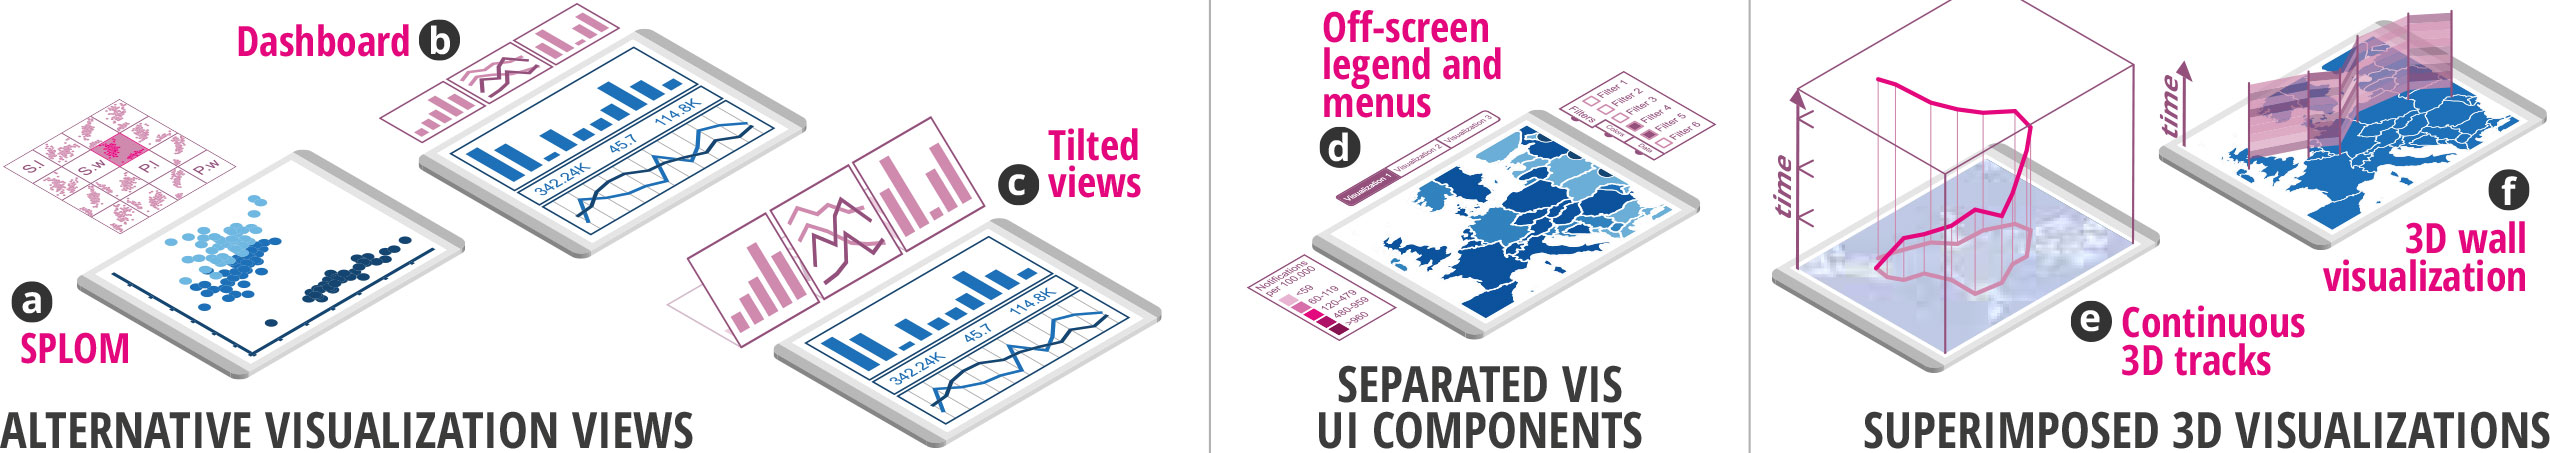
In our work, we describe exemplary techniques as part of several new visualization and interaction concepts.
The techniques build on visualization principles and tasks, including overview+detail, linking and brushing, data filtering, and visual comparison.
Also, MARVIS allows for adapting and enhancing existing visualization techniques.
The concepts can be organized into two categories: single mobile device with AR and two
or more mobile devices with AR.
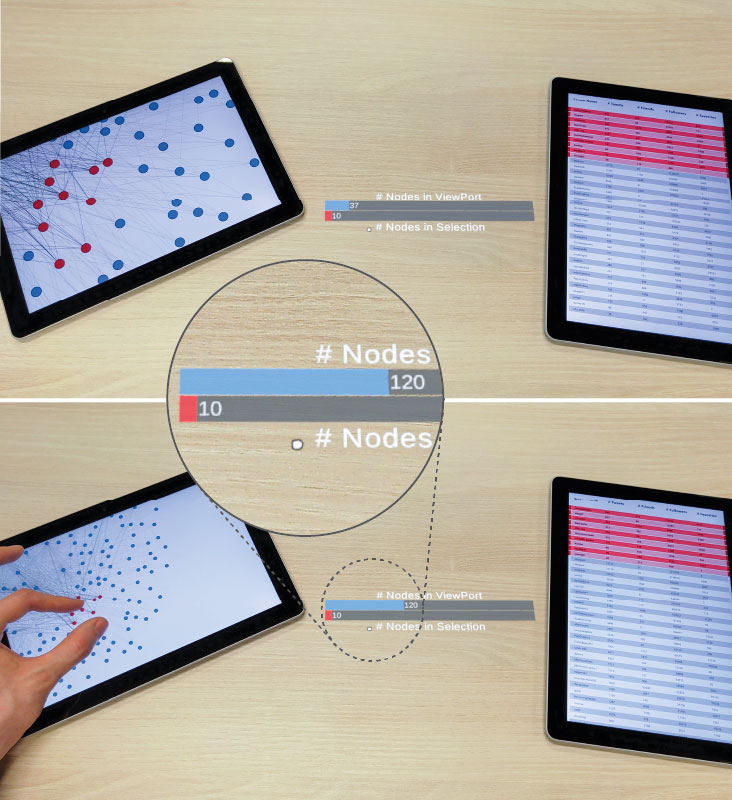
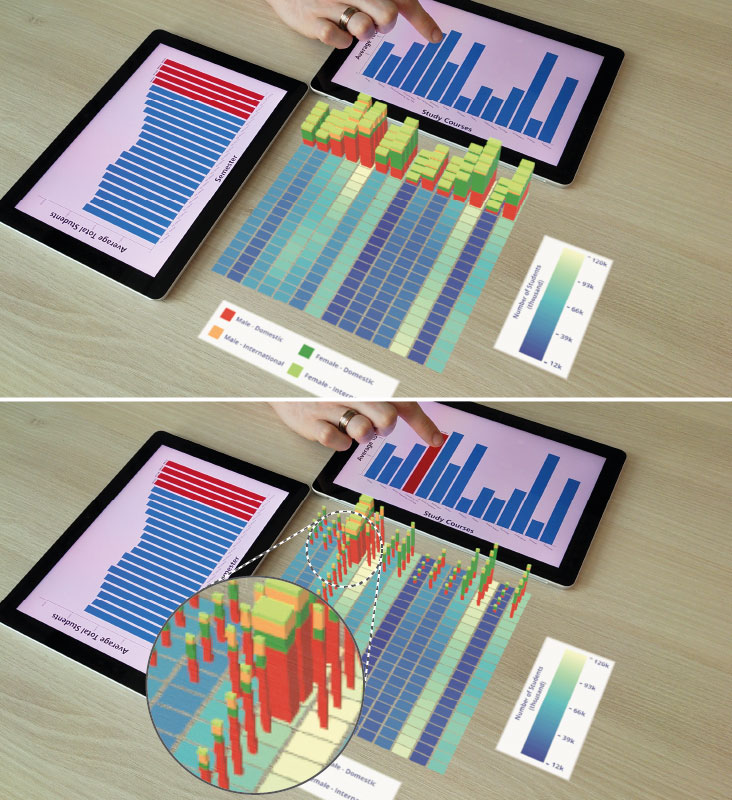
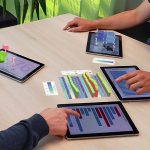
Note that information shown in AR is colored in purple, that of mobile devices in blue.
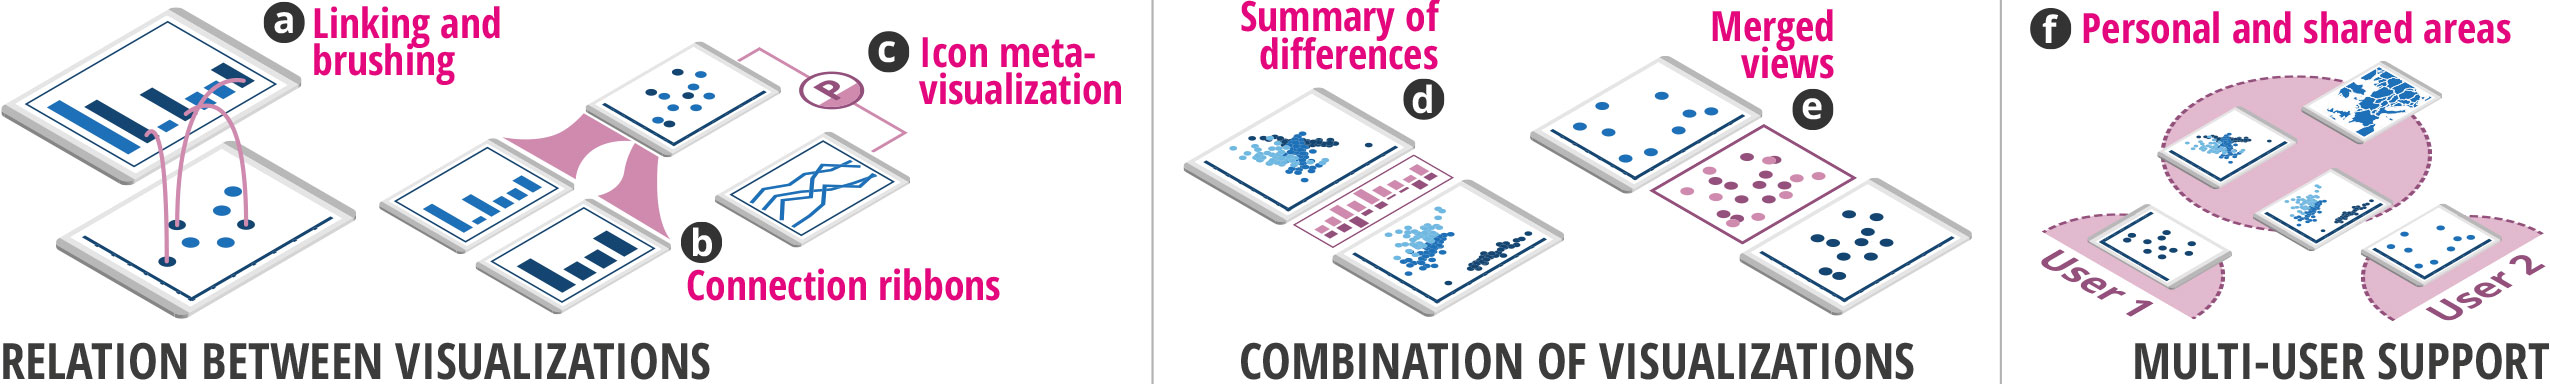
Visualizations, and Multi-User Support. (a) Linking and brushing supported by curved AR connections; (b) Ribbons between devices indicate the relative proportions; (c) Icon meta-visualizations reveal view relations; (d) AR bar chart summarizes calculated differences between views; (e) Merging two views in AR; (f) Personal and shared areas for collaborative activities;
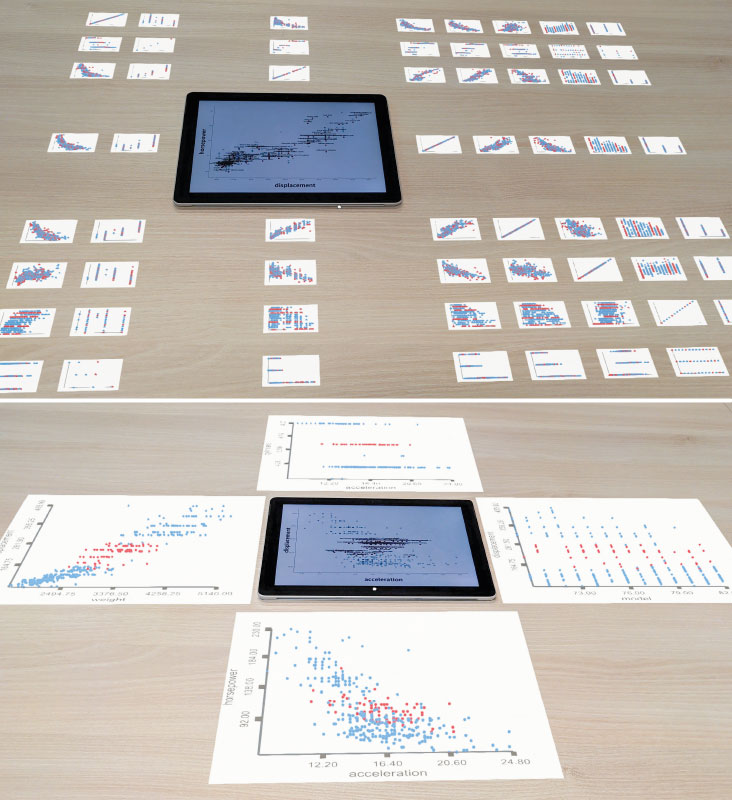
Prototype Application: Implemented Example Use Cases
Our prototype application consists of six implemented example use cases and exemplifies how our proposed concepts can be realized. Each example demonstrates parts of our concepts, but also extends and enhances already existing visualization techniques.
Scatterplot Matrix Navigation
Node-Link Diagram and Attribute Visualization
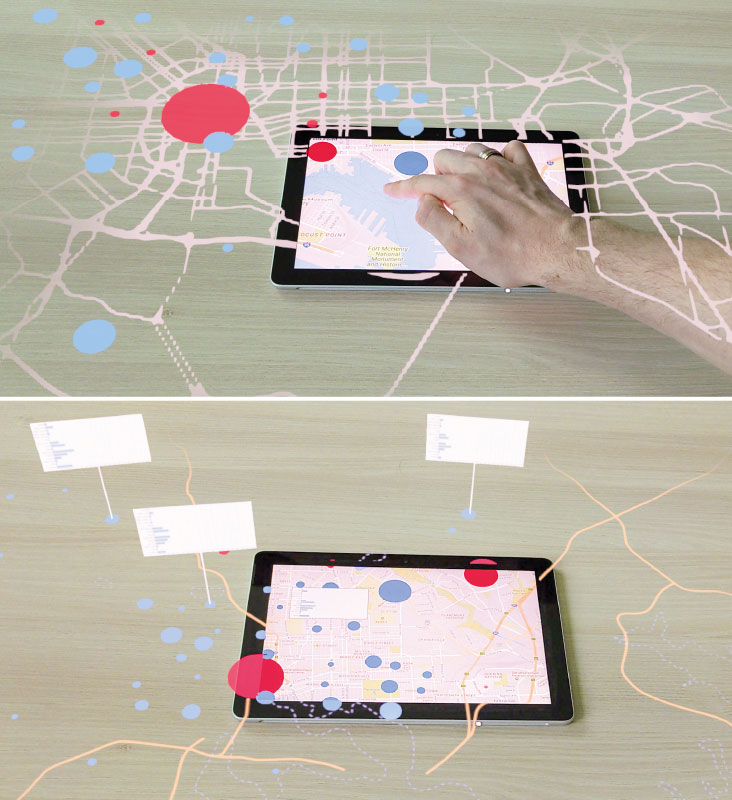
Map Navigation
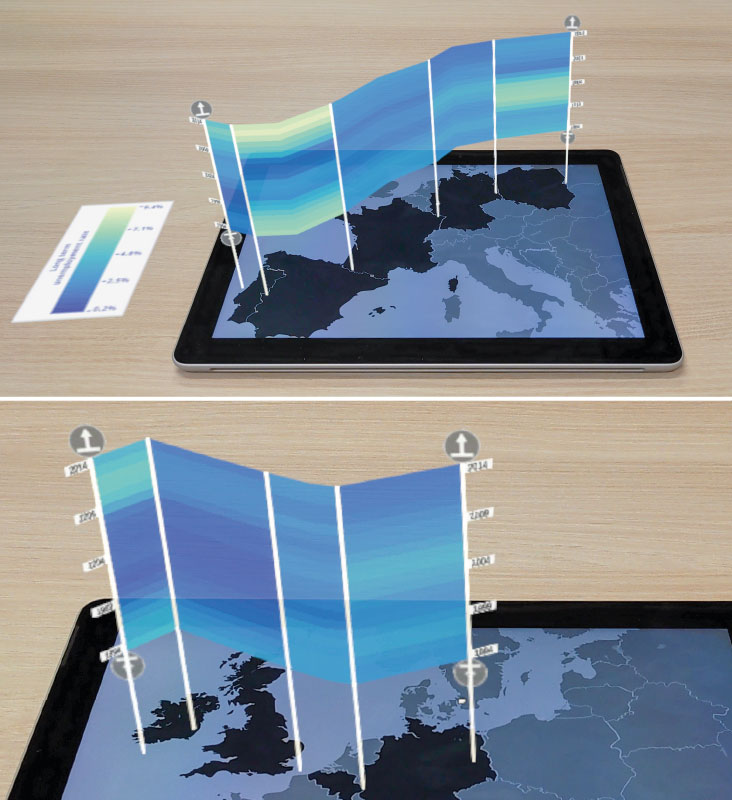
Non-Planar Slices on a Map
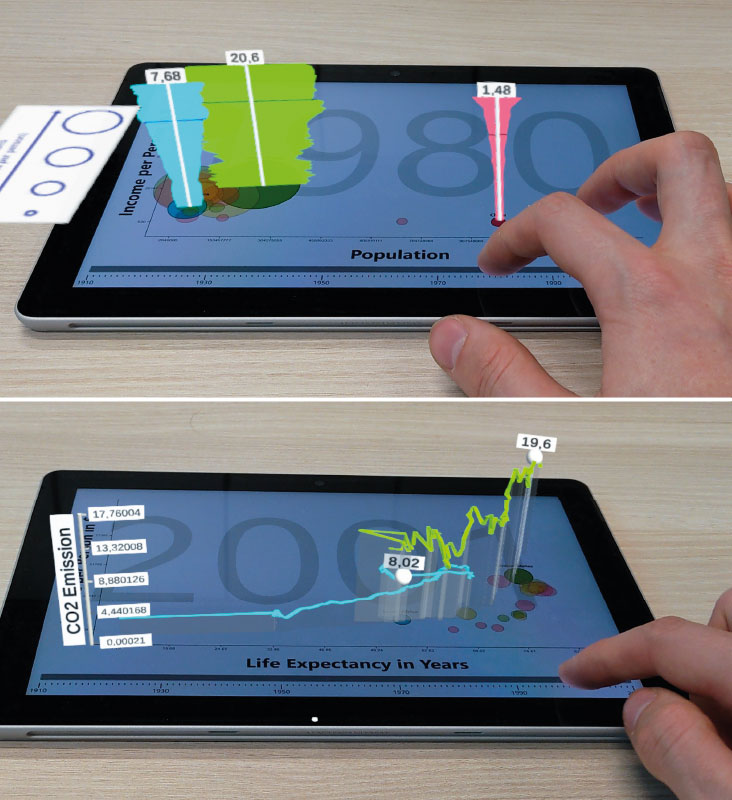
Scatterplot with
3D Glyphs and Trajectories
Combined Bar Charts with Heatmap and 3D Stacked Bars
Supplemental Material
Further information about participant’s expertise and a list of all grouped comments can be found in the supplemental material document.
Publication
@inproceedings{langner:2021:marvis,
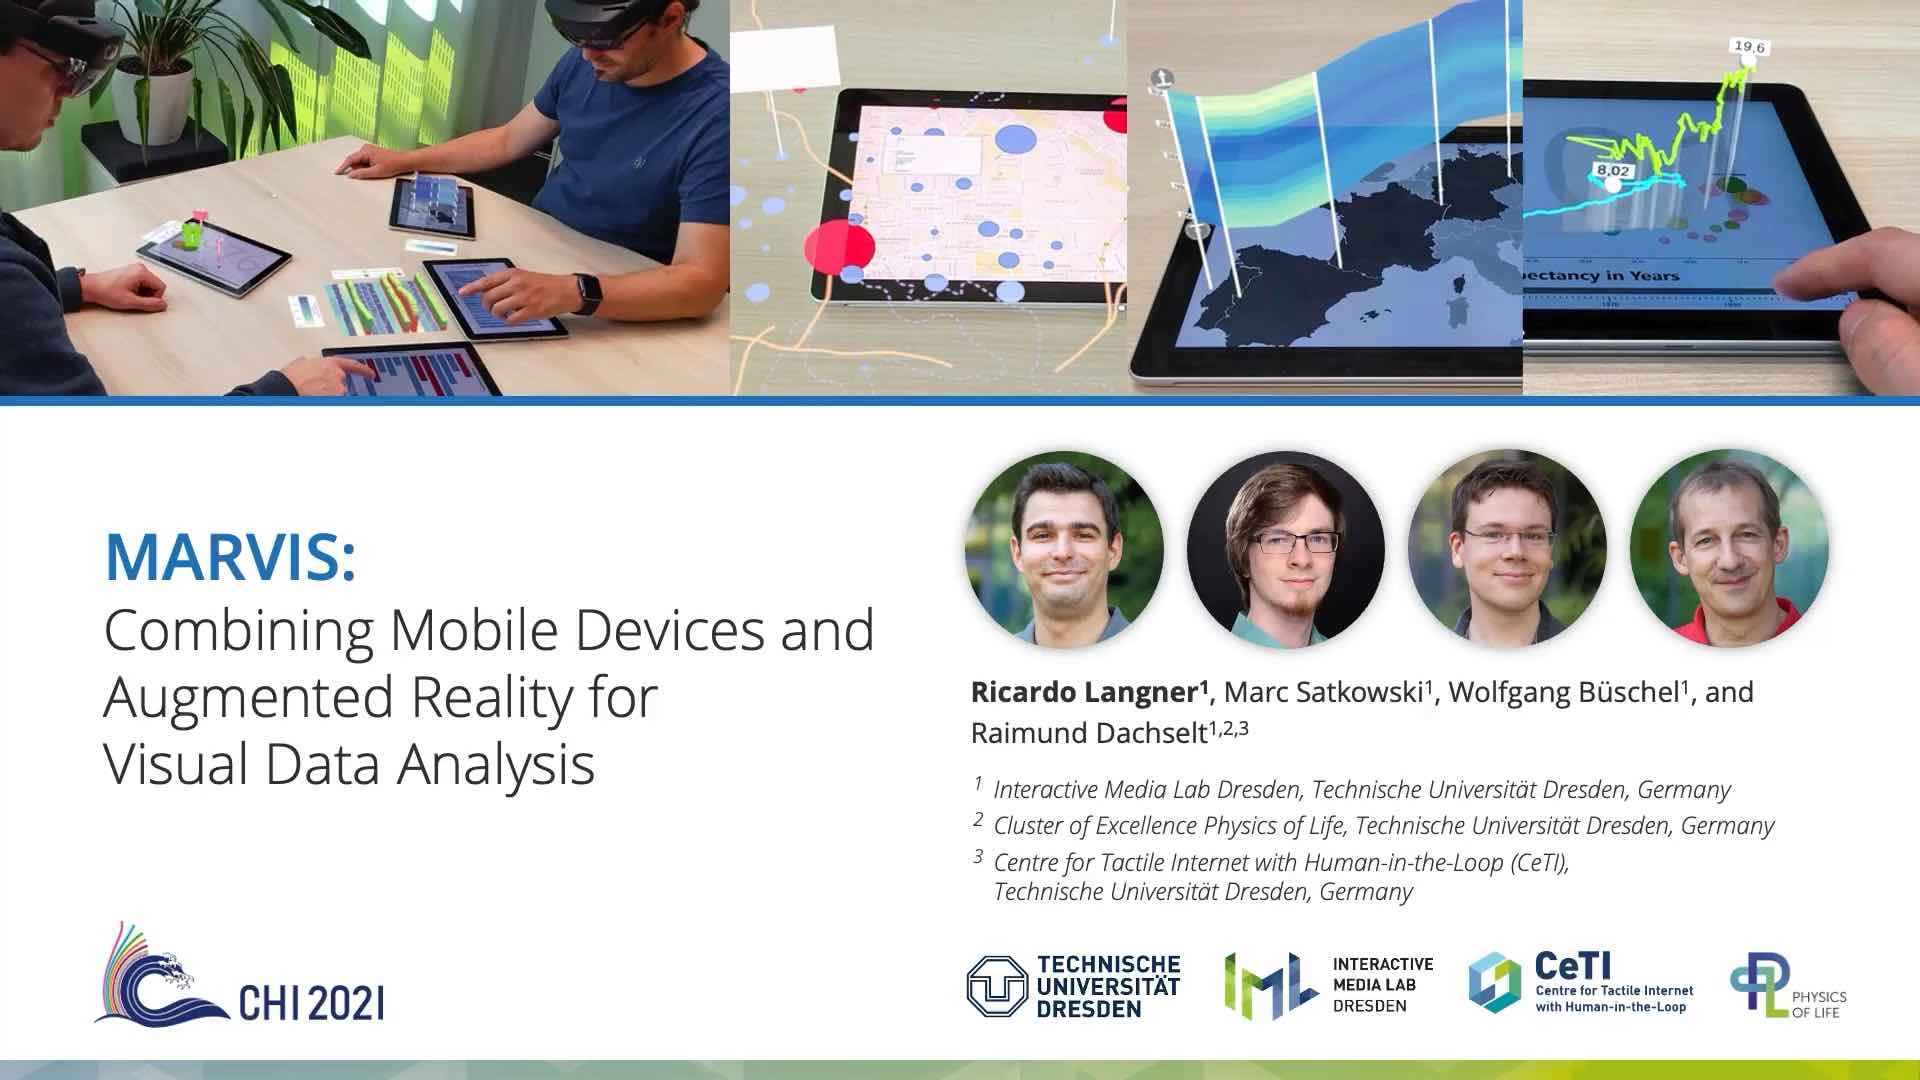
author = {Ricardo Langner and Marc Satkowski and Wolfgang B\"{u}schel and Raimund Dachselt},
title = {MARVIS: Combining Mobile Devices and Augmented Reality for Visual Data Analysis},
booktitle = {Proceedings of the 2021 ACM Conference on Human Factors in Computing Systems},
year = {2021},
month = {5},
isbn = {978-1-4503-8096-6/21/05},
location = {Yokohama, Japan},
numpages = {17},
doi = {10.1145/3411764.3445593},
publisher = {ACM},
address = {New York, NY, USA},
keywords = {data visualization, mobile devices, head-mounted augmented reality, cross-device interaction, data analysis, mobile data visualization, augmented displays, immersive analytics}
}Weitere Materialien