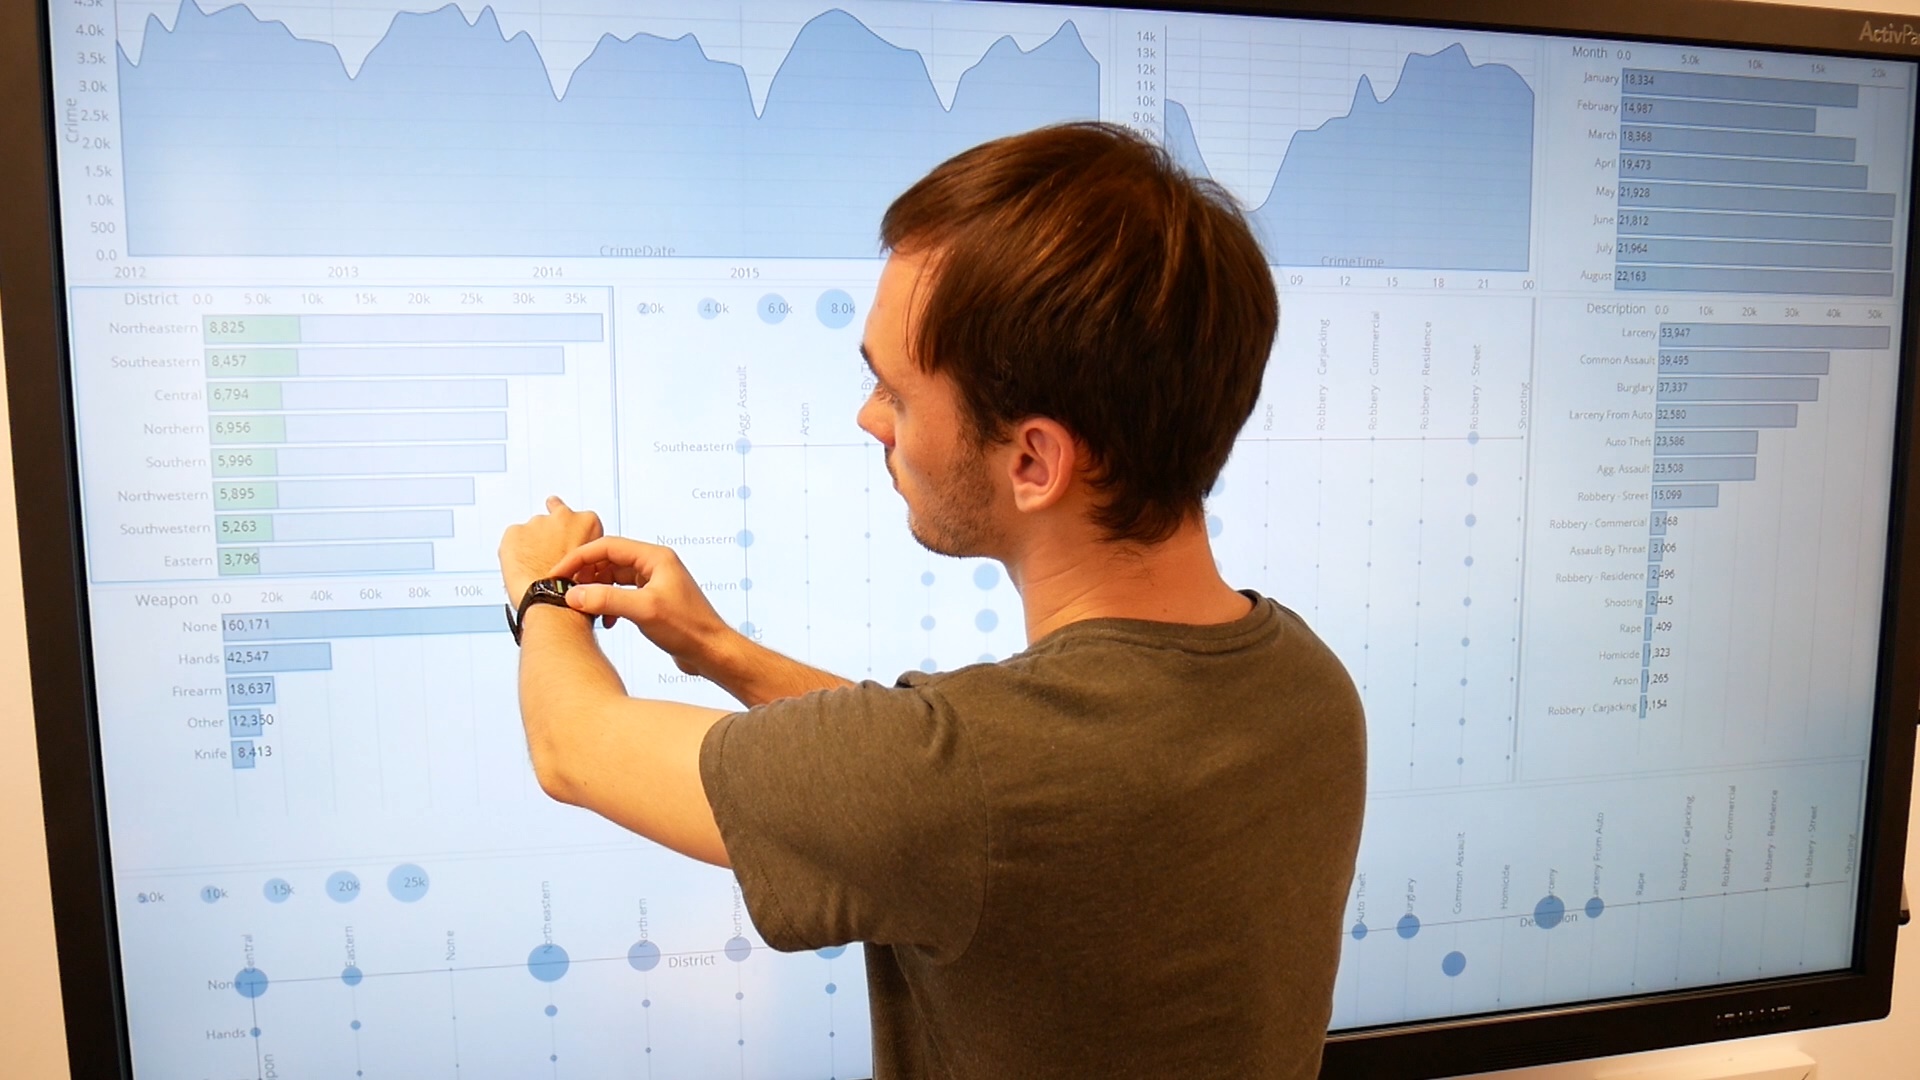
A conceptual framework enabling analysts to explore data items, track interaction histories, and alter visualization configurations through mechanisms using both a smartwatch and a large display in combination.
Video Illustrating our Concepts
In a hurry? We also have a 30-second preview video.
Table of Contents
Abstract
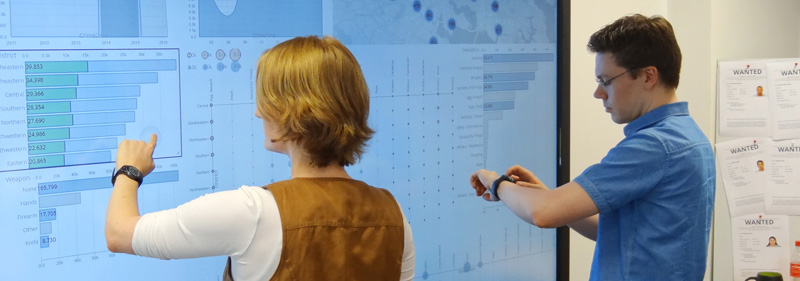
We explore the combination of smartwatches and a large interactive display to support visual data analysis. These two extremes of interactive surfaces are increasingly popular, but feature different characteristics—display and input modalities, personal/public use, performance, and portability.
In this paper, we first identify possible roles for both devices and the interplay between them through an example scenario. We then propose a conceptual framework to enable analysts to explore data items, track interaction histories, and alter visualization configurations through mechanisms using both devices in combination.
We validate an implementation of our framework through a formative evaluation and a user study. The results show that this device combination, compared to just a large display, allows users to develop complex insights more fluidly by leveraging the roles of the two devices. Finally, we report on the interaction patterns and interplay between the devices for visual exploration as observed during our study.
Presentation @ ACM CHI ’18
The David meets Goliath paper has been presented at the ACM CHI 2018 (Montréal, Quebec, Canada) in the Visualization Beyond the Desktop session.
The slides of the talk are available as a PDF.
Honorable Mention We are particularly pleased that we received the honorable mention award (top 5%) for our paper at the conference.
Additional Reads
- Article from the University of Maryland Institute for Advanced Computer Studies
- Blog post on Medium
Combining David and Goliath: Fundamentals
Roles of the Devices
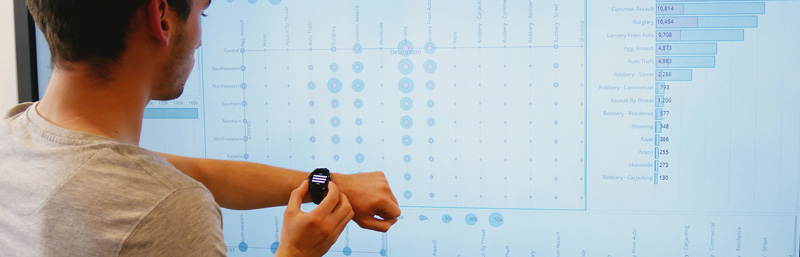
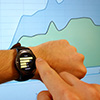
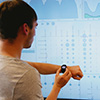
Each of the two devices—smartwatch and large display—has a specific role during visual analysis: By virtue of its size, the large interactive display serves as the primary display that provides visualizations of a dataset and can be used by analysts in parallel. In contrast, the smartwatch is a personal—and significantly smaller—device only used by its owner. Consequently, the watch is suitable as a secondary display, that can act as a user-specific storage for points of interests or parameter settings, as a mediator altering system reactions, or as a remote control by for distanced interaction.
Elementary Interaction Principles on the Smartwatch
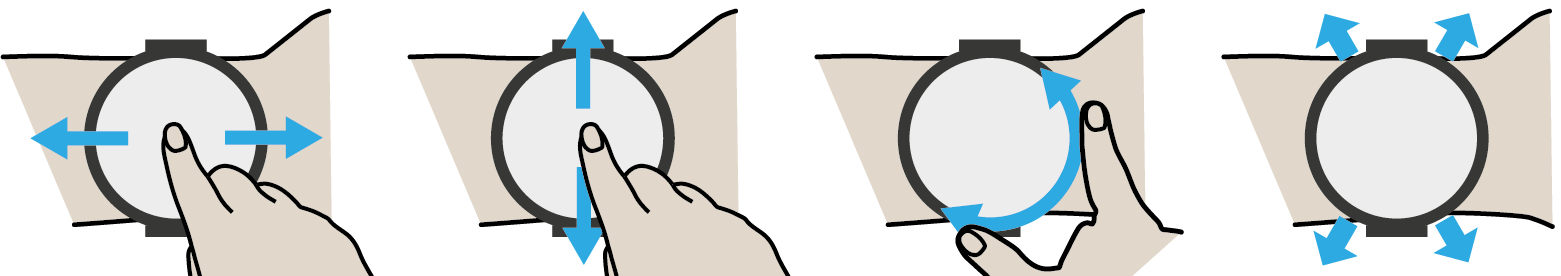
We propose to primarily use three interactions on the watch: swiping horizontally, swiping vertically, and rotating a physical control of the smartwatch (e.g., rotatable bezel or crown). Further, using the internal sensors of the smartwatch, the users’ arm movements can be used to support pointing. For transferring content, the axis along the arm is most suitable: swiping towards the shoulder can pull content from the large display onto the smartwatch, swiping from the wrist towards the hand (towards the large display) can allow to push content back. Additionally, the orthogonal axis can be used for scrolling through stored content.
Zones of Cross-Device Interaction
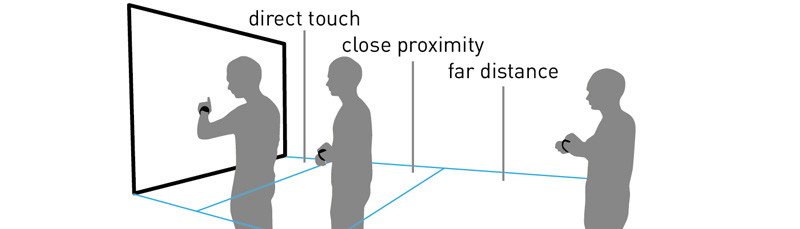
The cross-device interaction can happen in three zones: either at the large display using direct touch, in close proximity to the display but without touching it, or from a distance. Working from an overview distance, close proximity, or directly at the large display is not an either-or decision. There is always an interplay between the three: analysts interact in front of the large display to focus on details, step back to orient themselves, and again move closer to continue exploration. Consequently, the cross-device interaction should bridge these zones, i.e., allow both touch-based interaction as well as remote interaction at any time.
Scope of Interactions in Multi-User Setups
In common coordinated multiple view (CMV) applications, changes in one visualization (e.g., selection, filter, encoding) have global impact, i.e., are applied to all views. To avoid interference between analysts working in parallel, the effects of an interaction should only be applied to the visualization(s) currently in focus of the analyst as well as constrained to a short time period: when applying a selected adaptation via the smartwatch, the resulting change is only visible for a few seconds. At the same time, it must be possible to keep the altered data visualization permanently.
Conceptual Framework
Item Sets & Connective Areas
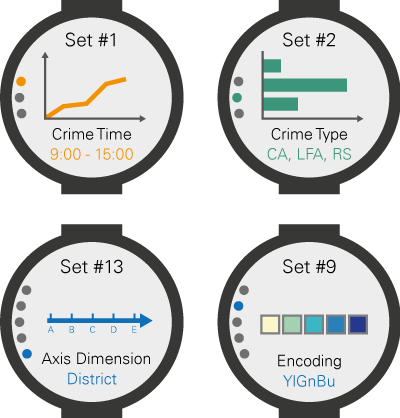
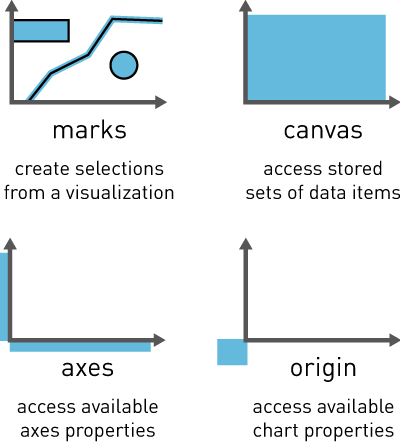
Creating & Managing Sets for Visual Exploration
Mapping Established Task Classifications to our Interaction Sequences
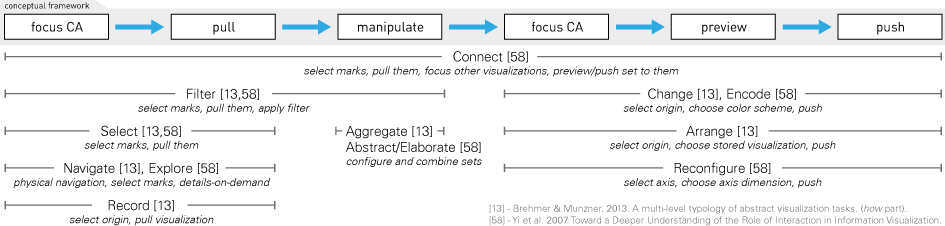
Our framework addresses a wide range of tasks, here illustrated by mapping two established task classifications by Brehmer and Munzner [13] and Yi et al. [58] onto interaction sequences that are enabled by our framework (examples given in italics). For some tasks, certain aspects are also still supported by the large display itself, e.g., zooming and panning from abstract/elaborate and explore [58]. Regarding the typology by Brehmer and Munzner [13], we focus on their how part. From this part, a few tasks (encode, annotate, import, derive) are not considered as they are going beyond the scope of this paper. CA: Connective Area.
Related Publications
@inproceedings{Horak2018,
author = {Tom Horak and Sriram Karthik Badam and Niklas Elmqvist and Raimund Dachselt},
title = {When David Meets Goliath: Combining Smartwatches with a Large Vertical Display for Visual Data Exploration},
booktitle = {Proceedings of the CHI Conference on Human Factors in Computing Systems},
year = {2018},
month = {4},
location = {Montreal, QC, Canada},
pages = {19:1--19:13},
doi = {10.1145/3173574.3173593},
url = {https://doi.org/10.1145/3173574.3173593},
publisher = {ACM}
}List of additional material
, Video
Demonstrating David Meets Goliath: Combining Smartwatches with a Large Vertical Display for Visual Data Exploration
@inproceedings{Horak2018a,
author = {Tom Horak and Sriram Karthik Badam and Niklas Elmqvist and Raimund Dachselt},
title = {Demonstrating David Meets Goliath: Combining Smartwatches with a Large Vertical Display for Visual Data Exploration},
booktitle = {Extended Abstracts of the CHI Conference on Human Factors in Computing Systems},
series = {CHI EA '18},
year = {2018},
month = {4},
location = {Montreal, QC, Canada},
pages = {D414:1--D414:4},
doi = {10.1145/3170427.3186497},
url = {https://doi.org/10.1145/3170427.3186497},
publisher = {ACM}
}List of additional material
, Video
Related Student Theses

Pointing Interaction with Mobile Devices Using Internal Sensors
Javid Abbasov October 2nd, 2017 until March 12th, 2018
Supervision: Tom Horak, Raimund Dachselt