Exploration of Markov Decision Processes (MDPs) with Probabilistic Model Checking (PMC) Results
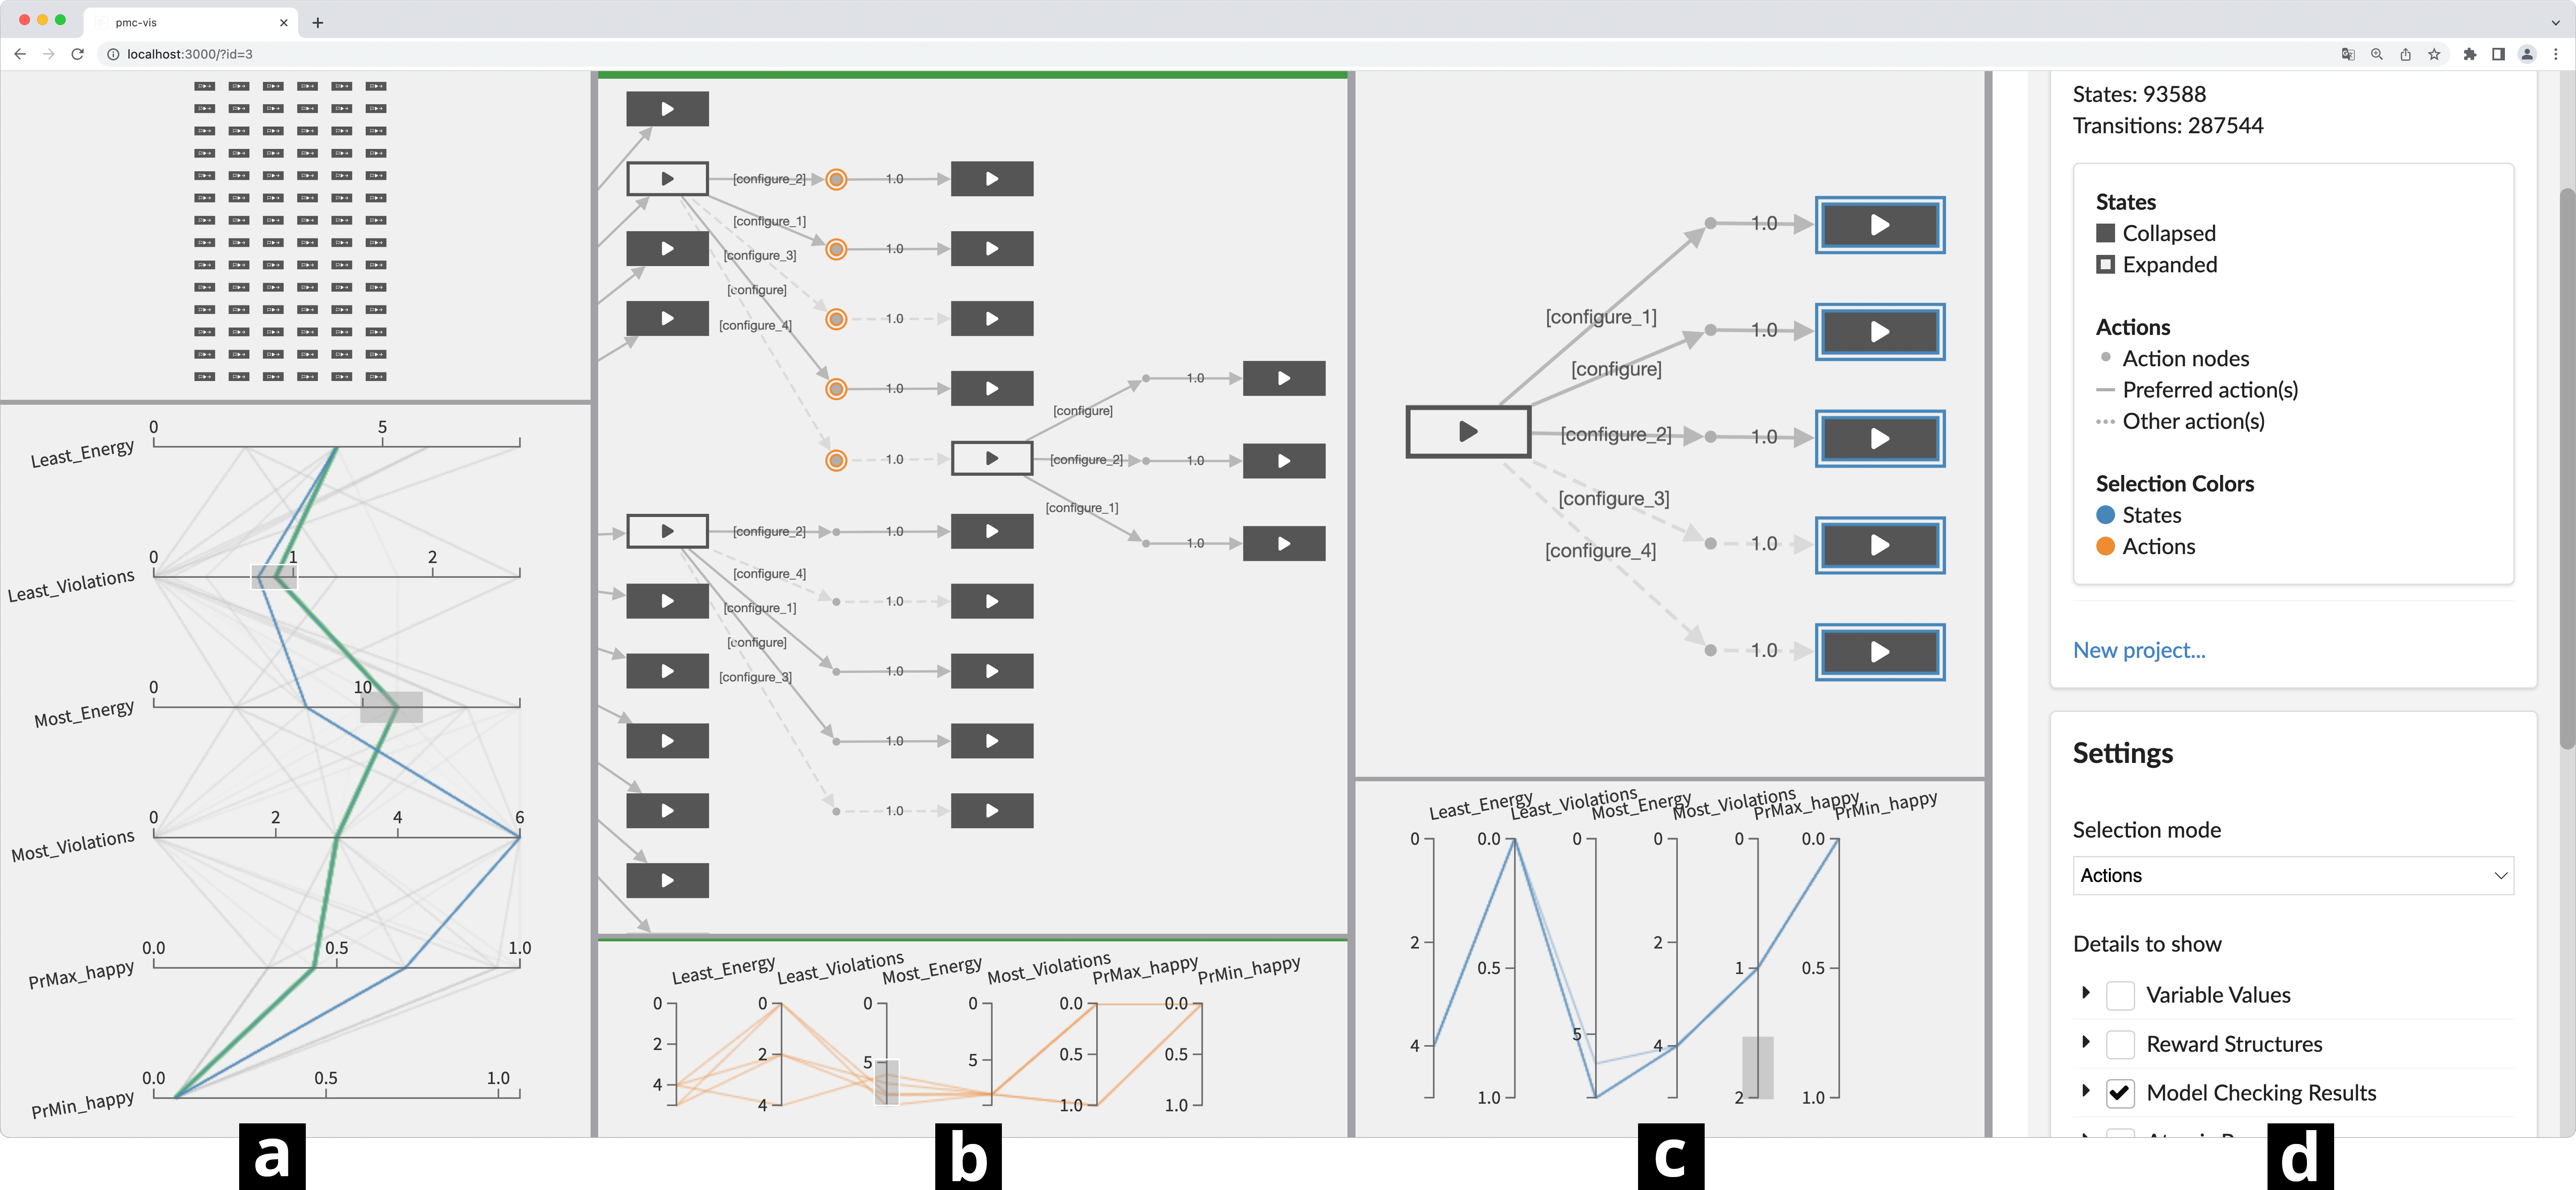
Screenshot of PMC-Vis, showing 3 panes (a, b, c). Pane (a) shows the initial states of the MDP (as a grid of unconnected nodes above, and as polylines in the Parallel Coordinates Plot below). Pane (b) shows a set of selected actions (in orange). Pane (c) shows a selection over the possible outcomes of a chosen action (states, in blue). Lastly, the settings sidebar can be seen in (d), currently linked to pane (b) as indicated by the green border on top of this pane.
Usage Scenarios
To validate our results with respect to DG-1 and DG-2, we illustrate the usage of PMC-Vis on the basis of an example model of a self-adaptive Server Management System (SMS). This model has a total of 93588 states, of which 84 are initial states. Roughly, the model describes how a number of tasks with differing workload must be distributed to a number of servers. Tasks can be distributed to various servers, but a single server can only compute for one task at a time. The workload that a server can manage depends on its hardware and software settings. Roughly speaking, the behavior of this model can be split onto 3 cyclic phases: (1) generating tasks, (2) re-configuring, and (3) assigning work.
These phases repeat until some termination criteria is reached (e.g., a set number of phases have been completed). With this example SMS, we will illustrate three individual scenarios. For simplicity, we consider the scenarios separately, although, in reality, users may work on their tasks in parallel or seamlessly switch between them. Scenario 1 deals with the model configuration, in which the user is interested in finding a good server setup. A server setup describes how many servers and what hardware to use. Scenario 2 covers the model exploration, which aims at developing an understanding of its behavior and structure. Finally, scenario 3 focuses on finding managing strategies that fulfil typical SMS objectives: In this example, (1) finishing all tasks at the end of a phase and (2) minimizing ongoing costs (e.g., energy costs).
Scenario-1: Model Configuration
Once the user opens the model in PMC-Vis, the graph view and attribute view of a single pane are populated with the 84 initial states of our model, encoding all the SMS parameters that cannot change at runtime (like server number and type). Finding a good initial configuration for our model (i.e., finding a server setup satisfying the users specifications) simply entails making a selection of the best candidates from those 84 initial states.
- the probability of finishing all assigned tasks (PrMinHappy, PrMaxHappy),
- the expected energy consumption over the task (LeastEnergy, MostEnergy), and
- the accrued violations for tasks not fulfilled (LeastViolations, MostViolations).
Scenario-2: Model Exploration
Scenario-3: Model Reconfiguration & Strategies
- Per-node details: Every node can show a tooltip with properties of interest (e.g., per-state PMC results, variable/parameter configurations, state labels and reward functions). If the user wants to change which properties appear in these tooltips and parallel coordinates plots, the settings sidebar provides a selection of all available properties.
- Parallel coordinates comparison: Nodes can be selected depending on the behavior set in the settings sidebar (only states, only actions, or both simultaneously). Action nodes summarize the properties of all states reachable from them, and, similar to states, they can be inspected in the parallel coordinates plots. In a process similar to Scenario-1, the user can compare selected actions by properties of interest to make a decision on which path to follow to continue exploring.
- Schedulers: In order to understand how non-determinism is resolved for maximum or minimum PMC results, the user can check the extracted scheduler information from the model checker. By selecting the property of interest in the scheduler settings, PMC-Vis will highlight all edges related to the actions a scheduler optimizing this property could take. For example, selecting PrMaxHappy as the scheduler property will indicate which actions to take to ensure that all system tasks will be terminated successfully. This not only allows the user to quickly discard sub-optimal actions and states, but also enables a initial understanding of optimal strategies for single goals with minimal effort. From the set of actions and states marked by the scheduler, it is also possible to refine the selection using the parallel coordinates plot as described in Scenario-1.
- Multiple Schedulers: Although only one scheduler can be selected at a time for a pane, multiple SMS objectives may need to be considered simultaneously (e.g., since a higher number of tasks completed goes along with higher energy consumption). To find a fitting strategy, we need to combine the strategies of multiple schedulers. While it is possible to define properties that combine our objectives, or use Pareto functions to find compromises, these alternatives do not allow dynamic adjustment of the trade-off applicable. For example, one may not be interested in a equal compromise between energy consumption and task fulfilment, but instead want to favor one side over the other. With this in mind, PMC-Vis allows cloning panes as an alternative which we believe suffices to support such multi-scheduler decisions in most cases. As stated earlier, each parallel coordinates plot can be manually set to select configurations optimal to multiple simultaneous criteria. With multiple simultaneous panes showing the same decision space, a side-by-side comparison of the parallel coordinates plot selections as well as the scheduler highlighting on the graph view can be inspected.
- Exporting the strategy: Aided by the previously discussed features, the user has accrued a sequence of decisions that altogether constitute the desired strategy to manage the servers, until the final states of the MDP are reached. However, the free exploration of the MDP in several panes means that not only the desired choices, but also several dangling nodes and half-explored paths may be present. To support the user in organizing their work across several panes PMC-Vis allows marking nodes of interest (via the context menu), which can then be exported (i.e., downloaded as JSON) independently of the pane content for all panes at once. This exported sequence may contain gaps within the MDP, either because the user did not mark all the relevant nodes that they found, or because it was unclear which states best suited the strategy at certain points. For such cases, it is possible to import the working strategy onto a pane of PMC-Vis, and in a similar process to \emph{Scenario-2}, the user may continue to explore the gaps in the system until a strategy has been completed.
Video Walk-throughs
Since our paper discusses a visual tool which is more easily explained by watching it in action, we prepared the following videos to illustrate the discussed usage scenarios.
- Scenario 1: Intro to the Server Management System + Finding good initial configurations:
- Scenario 2: Understanding the model behavior by finding patterns
- Scenario 3: Reconfiguration and schedulers
Publication
@inproceedings{pmc-vis-2023,
author = {Max Korn and Juli\'{a}n M\'{e}ndez and Sascha Kl\"{u}ppelholz and Ricardo Langner and Christel Baier and Raimund Dachselt},
title = {PMC-VIS: An Interactive Visualization Tool for Probabilistic Model Checking},
booktitle = {Proceedings of the 21st International Conference on Software Engineering and Formal Methods},
series = {Lecture Notes in Computer Science},
year = {2023},
month = {11},
location = {Eindhoven Netherlands},
doi = {10.1007/978-3-031-47115-5_20},
publisher = {Springer}
}
Weitere Materialien
@inproceedings{pmc-vis-2023,
author = {Max Korn and Juli\'{a}n M\'{e}ndez and Sascha Kl\"{u}ppelholz and Ricardo Langner and Christel Baier and Raimund Dachselt},
title = {PMC-VIS: An Interactive Visualization Tool for Probabilistic Model Checking},
booktitle = {Proceedings of the 21st International Conference on Software Engineering and Formal Methods},
series = {Lecture Notes in Computer Science},
year = {2023},
month = {11},
location = {Eindhoven Netherlands},
doi = {10.1007/978-3-031-47115-5_20},
publisher = {Springer}
}Weitere Materialien
DOI to the reproducibility package in Zenodo
https://doi.org/10.5281/zenodo.8172531
This package includes the docker images, experiments, source code and instructions on how to replicate our results.