Abstract
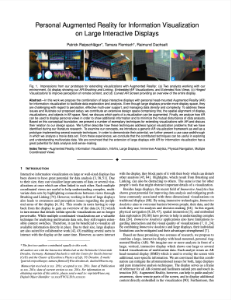
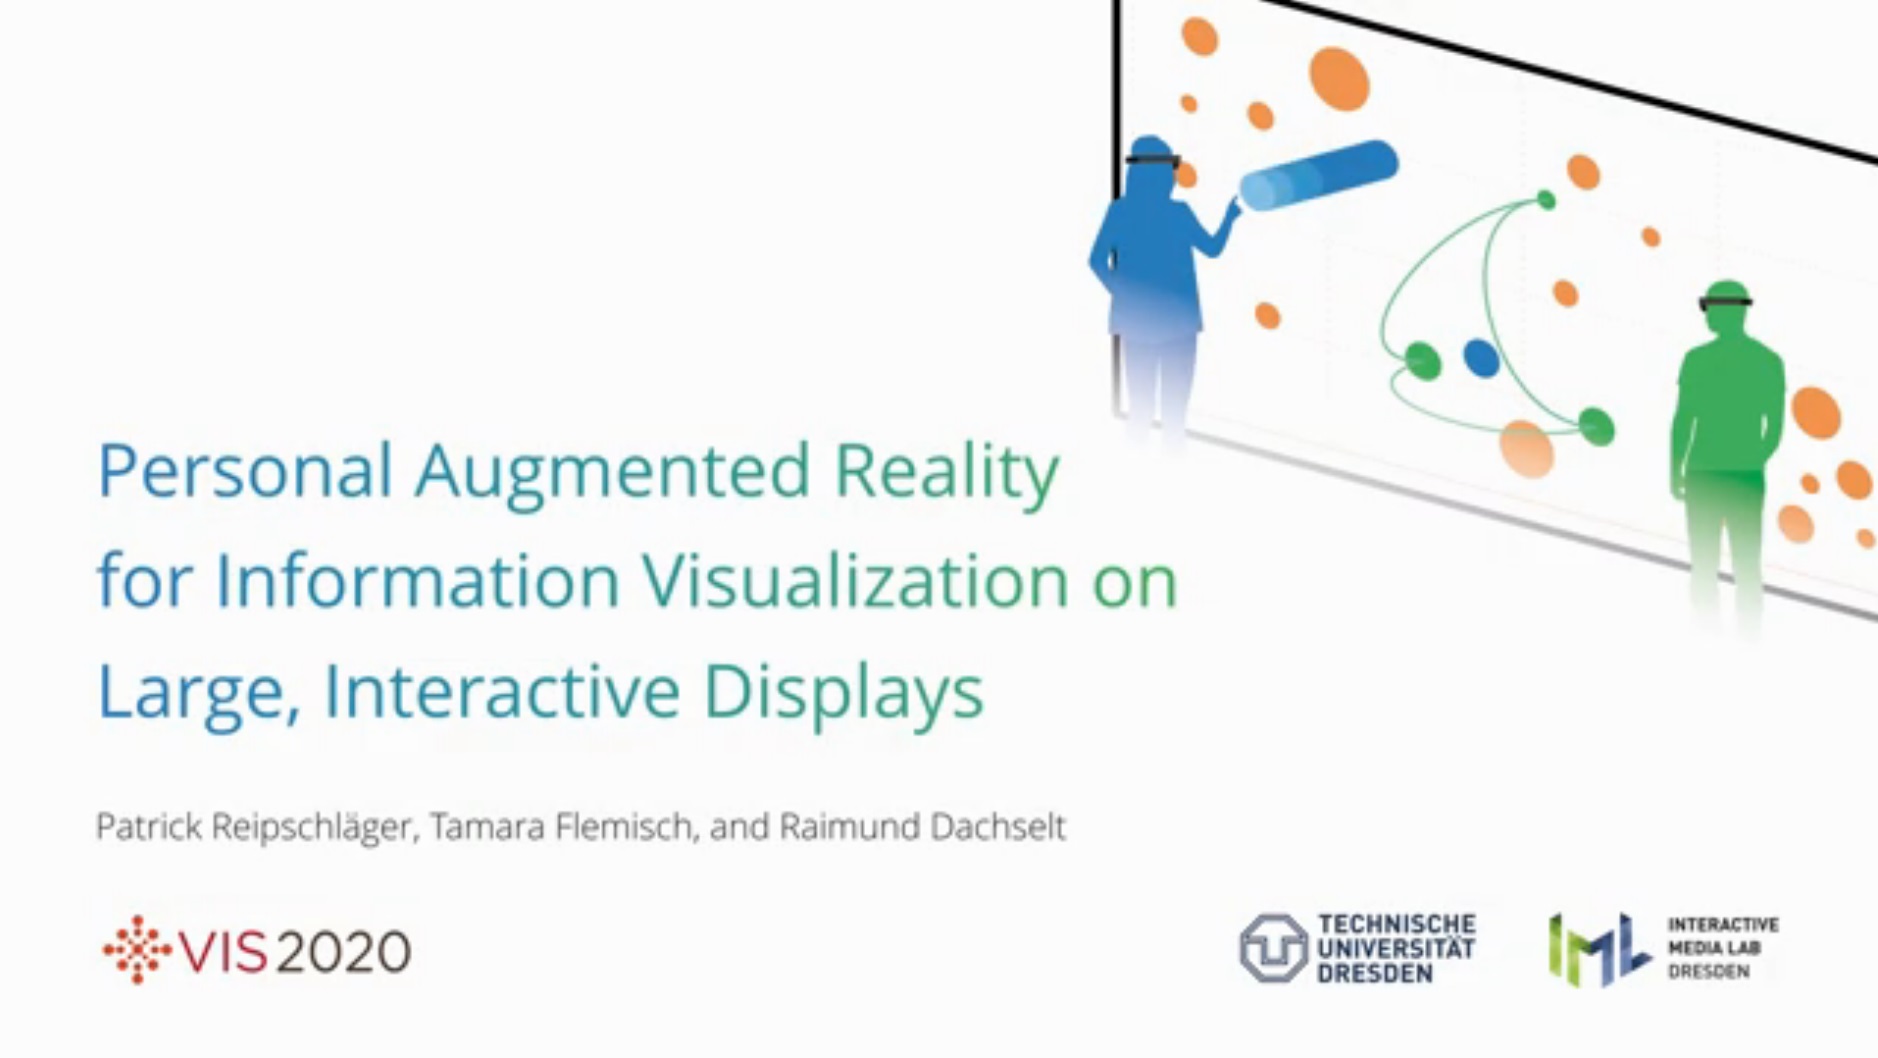
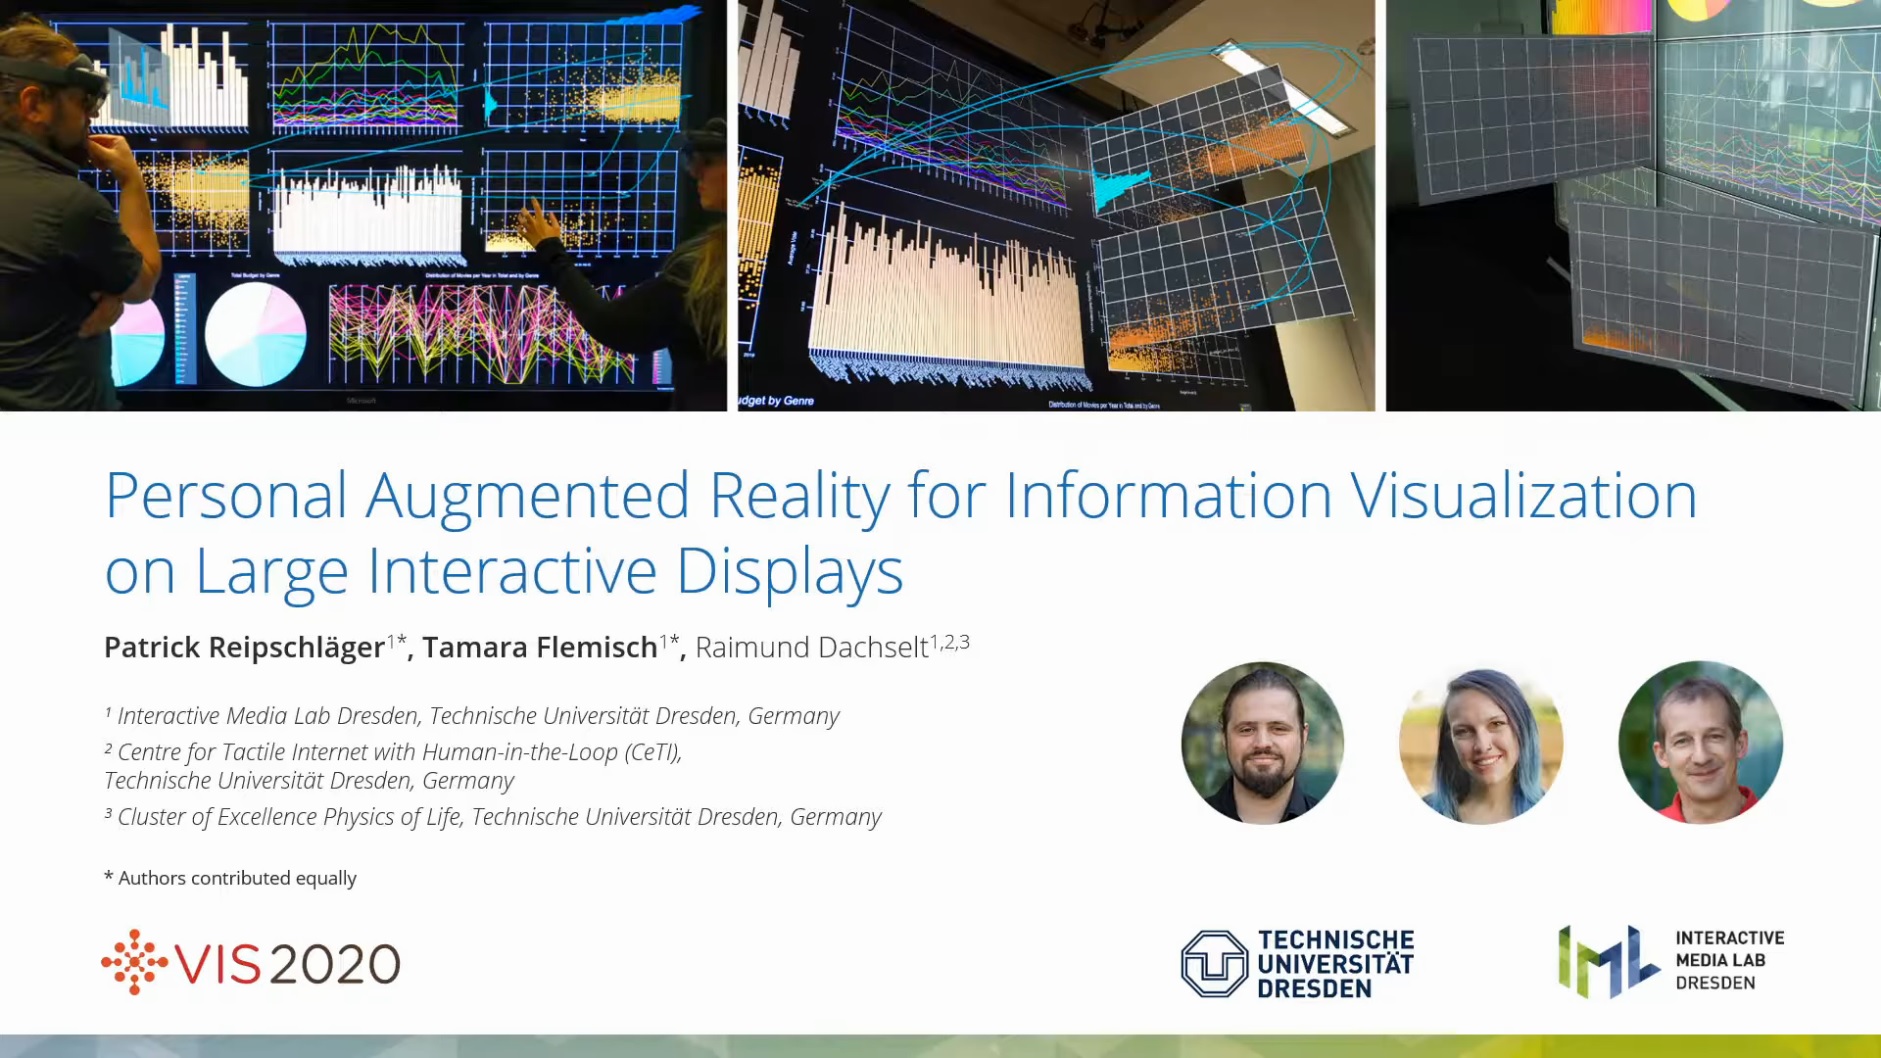
In this work we propose the combination of large interactive displays with personal head-mounted Augmented Reality (AR) for information visualization to facilitate data exploration and analysis. Even though large displays provide more display space, they are challenging with regard to perception, effective multi-user support, and managing data density and complexity. To address these issues and illustrate our proposed setup, we contribute an extensive design space comprising first, the spatial alignment of display, visualizations, and objects in AR space. Next, we discuss which parts of a visualization can be augmented. Finally, we analyze how AR can be used to display personal views in order to show additional information and to minimize the mutual disturbance of data analysts. Based on this conceptual foundation, we present a number of exemplary techniques for extending visualizations with AR and discuss their relation to our design space. We further describe how these techniques address typical visualization problems that we have identified during our literature research. To examine our concepts, we introduce a generic AR visualization framework as well as a prototype implementing several example techniques. In order to demonstrate their potential, we further present a use case walkthrough in which we analyze a movie data set. From these experiences, we conclude that the contributed techniques can be useful in exploring and understanding multivariate data. We are convinced that the extension of large displays with AR for information visualization has a great potential for data analysis and sense-making.
Research Article
Accompanying Research Video
In a hurry? We also have a 30-second preview video.
u2vis: Universal Unity Visualization Framework
One of the main contributions of the paper is u2vis, our data-driven visualization framework for Unity which natively supports Augmented Reality applications.
The framework can be configured completely in the Unity editor, is easily extendable, and is publicly available on GitHub: github.com/imldresden/u2vis

Slide Deck
We presented our work at the IEEE VIS conference on Oct 29 in the Immersion session (8:00 Mountain Time, 15:00 CET).
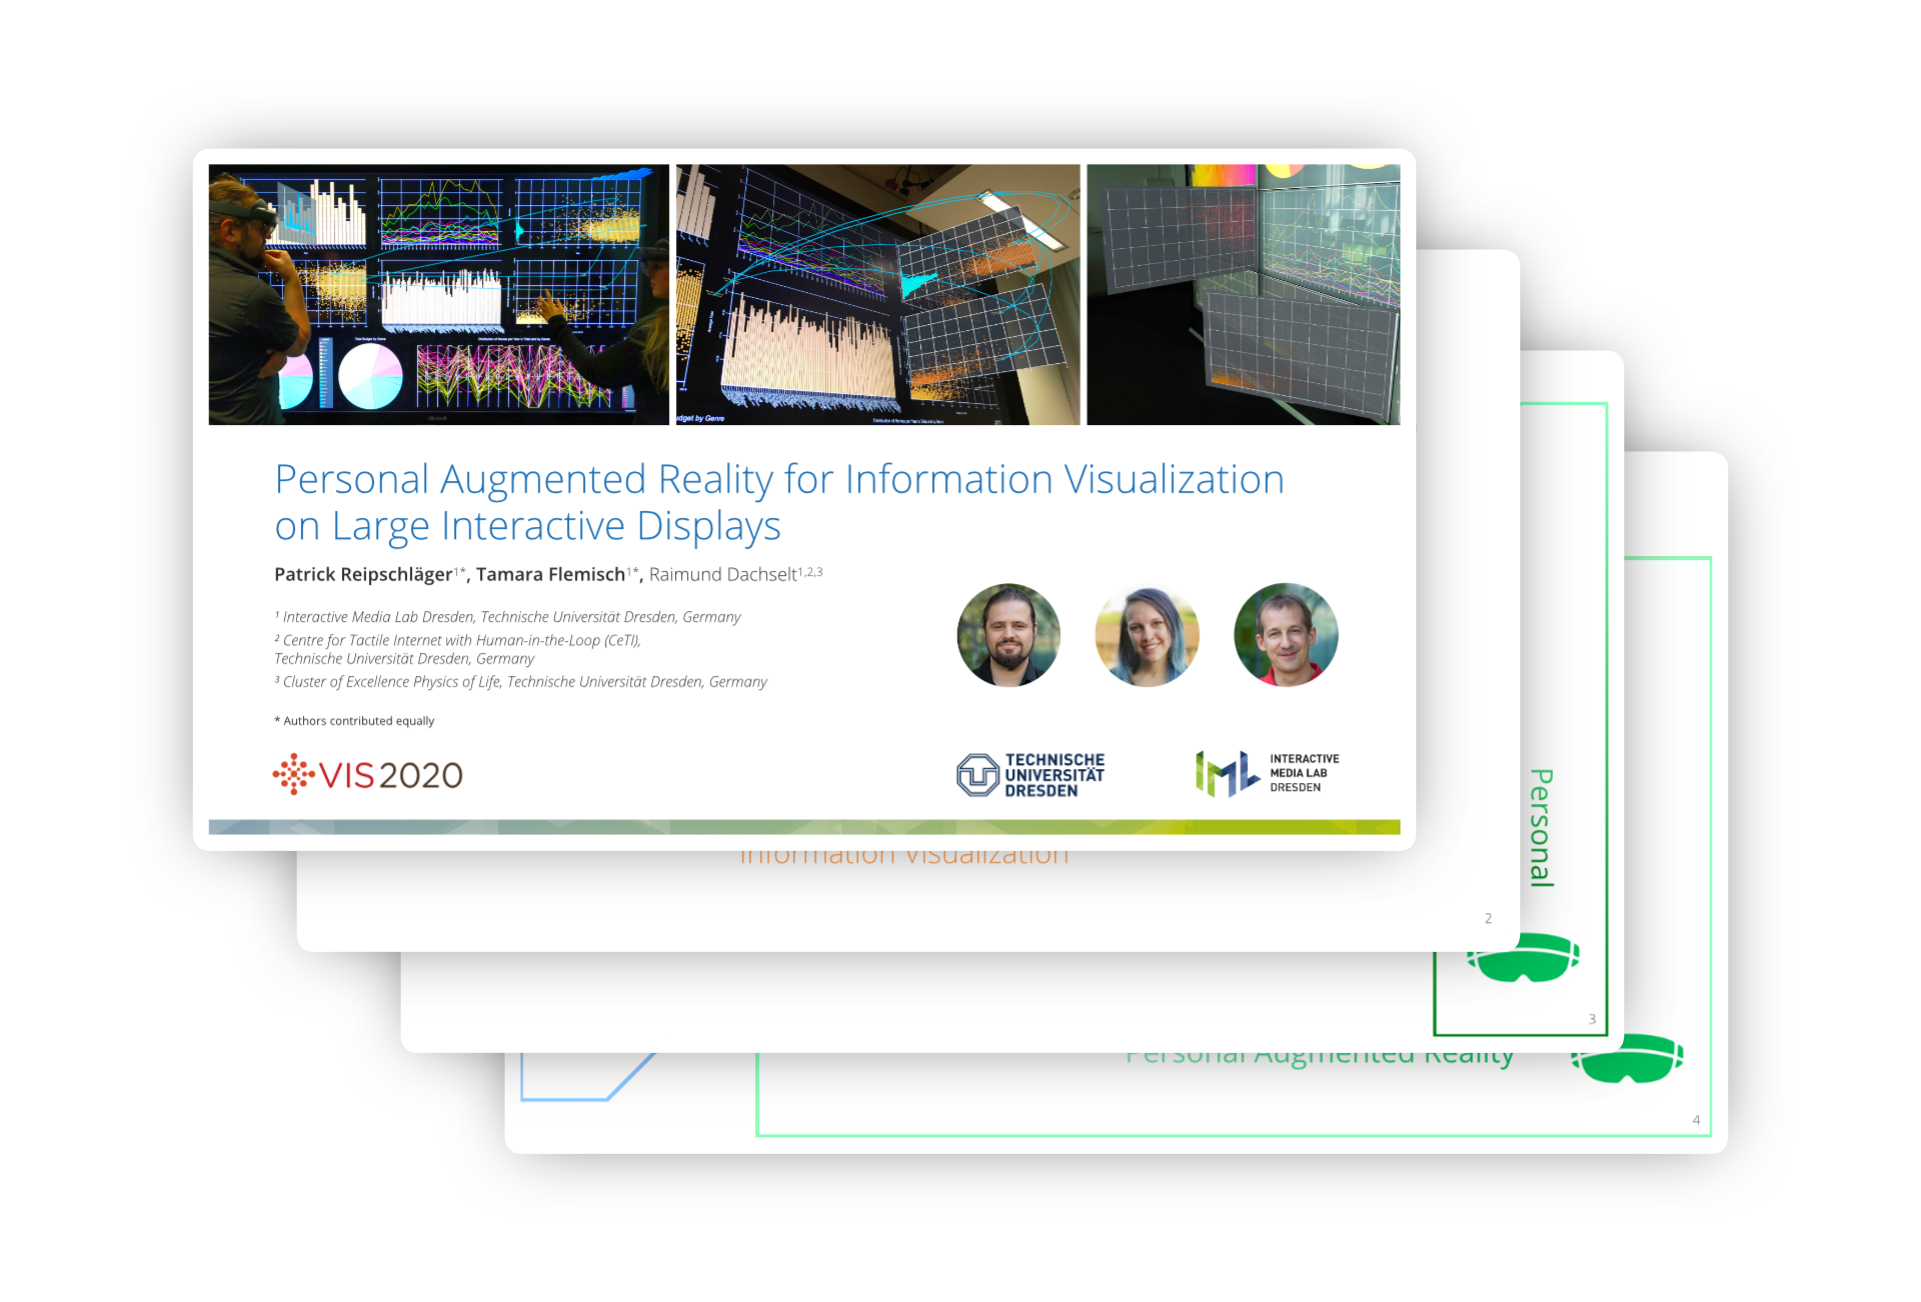
Download Slides (93mb)
Publication
@article{Reipschlaeger2021,
author = {Patrick Reipschl\"{a}ger and Tamara Flemisch and Raimund Dachselt},
title = {Personal Augmented Reality for Information Visualization on Large Interactive Displays},
journal = {IEEE Transactions on Visualization and Computer Graphics},
volume = {27},
issue = {2},
year = {2021},
month = {2},
location = {Salt Lake City, UT, USA},
pages = {1182--1192},
numpages = {11},
doi = {10.1109/TVCG.2020.3030460},
publisher = {IEEE},
keywords = {Augmented Reality, Information Visualization, InfoVis, Large Displays, Immersive Analytics, Physical Navigation, Multiple Coordinated Views}
}Weitere Materialien
, Video
Related Student Theses

Magische AR Linsen zur Informationsvisualisierung auf großen Displays
Remke Dirk Albrecht 13. April 2020 bis 14. September 2020
Betreuung: Patrick Reipschläger, Tamara Flemisch, Raimund Dachselt

Magische Augmented Reality Linsen für Informationsvisualisierung
Christoph Plagge 13. November 2017 bis 16. April 2018
Betreuung: Patrick Reipschläger, Raimund Dachselt

Analyse von 3D Visualisierungen durch die Kombination von Interaktiven Oberflächen mit Augmented Reality Head-Mounted Displays
Maximilian Gräf 20. November 2017 bis 23. April 2018
Betreuung: Patrick Reipschläger, Raimund Dachselt

Kombination von interaktiven Oberflächen und Augmented Reality zur Visualisierung multivariater Daten in Node-Link-Diagrammen
Jonas Fohry 6. Dezember 2019 bis 21. Februar 2020
Betreuung: Tamara Flemisch, Patrick Reipschläger, Raimund Dachselt

